Nothing new to add, I still think the markets are topping. Waiting for confirmation if we have a top or one final high with divergences. After that expect a-b-c lower around mid-February.
TECHNICAL PICTURE and ELLIOTT WAVES
Short term - the move higher looks like a-b-c, but we need reversal lower next week for confirmation. According to RSI this is the final move. We could see higher high with divergences to test the trend line, but that is all.
Intermediate term - the trend line is tested for the second time. Even if we see one final higher high it will be short living and create divergences. Break outs did not occur with overbought indicators and divergence. Pullback to reset the indicators and then break out.
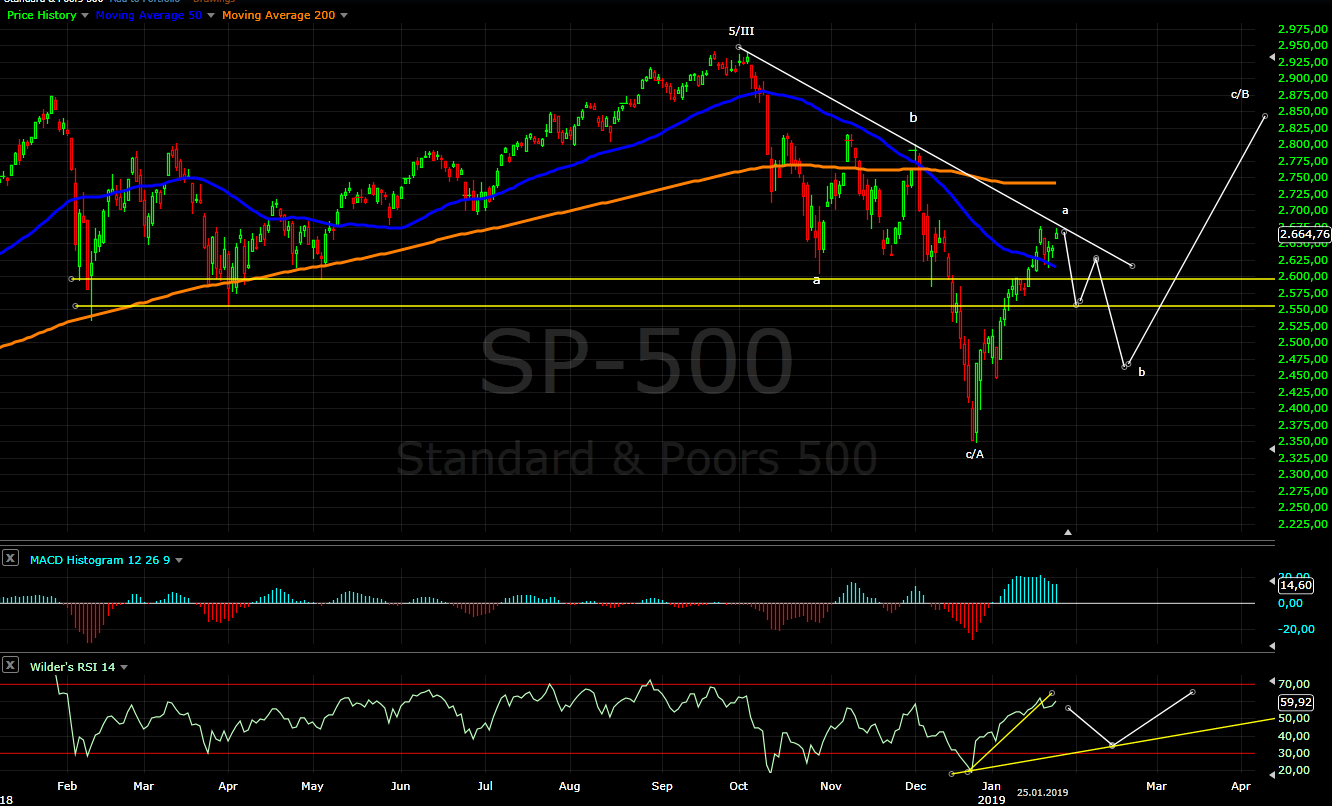
Long term - wave B running for IV from 2009. Possibilities are simple zig-zag or triangle to burn time.
MARKET BREADTH INDICATORS
Market Breadth Indicators - the oscillators turning down from very extended levels, the trend following indicators with buy signal.
McClellan Oscillator - extremely overbought and double divergence.
McClellan Summation Index - buy signal.
Weekly Stochastic of the Summation Index - buy signal, reached the overbought level.
Bullish Percentage - buy signal.
Percent of Stocks above MA50 - reached the 75 level and making a pause.
Fear Indicator VIX - we should see a move higher for the VIX and lower for the indexes.
Advance-Decline Issues - turned lower.
HURST CYCLES
Day 21 for the 40 day cycle.
Week 5 for the 20 week cycle. Shorter cycles possible 40 week low in Dec.2018 so we will keep an eye how fast the pattern develops.
Jan 27, 2019
Jan 19, 2019
Weekly preview
I was expecting something around resistance 2620 for c=a, but we saw spikes on Thursday and Friday. Now we have c=1,23xa and for c 5=0,618(1to3) common target for the fifth wave. Every index and share I look at shows complete pattern... so I think the indexes are close to a top. I was expecting turn date around MLK day and I thought it will be a low, but now it is obvious it will be a high.
Next we should see topping and at least 50% retracement, but I think it will be more like 61,8%.
The big picture a-b-c for B higher running. Last week I explained in details what I see so nothing new to add. Now all indexes joined the NDX and overlap with the previous waves... I do not know how to twist this bearish and count major top.
TECHNICAL PICTURE and ELLIOTT WAVES
Short term - some counting impulse, I think a-b-c fits better. At the end the outcome will be the same. Despite the spikes on Thursday and Friday the pattern is still valid and shows common Fibo measurements - at the same levels you have the target for wave 5 and on higher degree c=1,23xa.
Intermediate term - I expect something like in March.2018. The price should spend time below MA200 topping - lower 100 points to support, retracing more of the decline and bigger leg lower to retrace 50%-61,8% of the whole rally for b/B.
RSI very steep advance this is not sustainable and it should cool off.
Long term - wave B running for IV from 2009. Possibilities are simple zig-zag or triangle to burn time.
MARKET BREADTH INDICATORS
Market Breadth Indicators - the oscillators very overbought so it is time for a pause.
McClellan Oscillator - very overbought with divergence.
McClellan Summation Index - buy signal.
Weekly Stochastic of the Summation Index - buy signal.
Bullish Percentage - buy signal.
Percent of Stocks above MA50 - in the middle of the range .
Fear Indicator VIX - one push to 25 and lower again.
Advance-Decline Issues - very overbought with divergence.
HURST CYCLES
Day 17... a good time for a short term high and decline for mid-cycle low.
Week 4 for the 20 week cycle. Shorter cycles possible 40 week low in Dec.2018 so we will keep an eye how fast the pattern develops.
Tom Demark SEQUENTIAL AND COUNTDOWN - this technique spots areas of exhaustion.
Sell setup completed and this time I think it will be really a sell.
Short term - some counting impulse, I think a-b-c fits better. At the end the outcome will be the same. Despite the spikes on Thursday and Friday the pattern is still valid and shows common Fibo measurements - at the same levels you have the target for wave 5 and on higher degree c=1,23xa.
Intermediate term - I expect something like in March.2018. The price should spend time below MA200 topping - lower 100 points to support, retracing more of the decline and bigger leg lower to retrace 50%-61,8% of the whole rally for b/B.
RSI very steep advance this is not sustainable and it should cool off.
Long term - wave B running for IV from 2009. Possibilities are simple zig-zag or triangle to burn time.
MARKET BREADTH INDICATORS
Market Breadth Indicators - the oscillators very overbought so it is time for a pause.
McClellan Oscillator - very overbought with divergence.
McClellan Summation Index - buy signal.
Weekly Stochastic of the Summation Index - buy signal.
Bullish Percentage - buy signal.
Percent of Stocks above MA50 - in the middle of the range .
Fear Indicator VIX - one push to 25 and lower again.
Advance-Decline Issues - very overbought with divergence.
HURST CYCLES
Day 17... a good time for a short term high and decline for mid-cycle low.
Week 4 for the 20 week cycle. Shorter cycles possible 40 week low in Dec.2018 so we will keep an eye how fast the pattern develops.
Tom Demark SEQUENTIAL AND COUNTDOWN - this technique spots areas of exhaustion.
Sell setup completed and this time I think it will be really a sell.
Subscribe to:
Posts (Atom)