Intermediate term view - I do not see a top, I expect final move higher before a significant correction.
Optimism on Monday the indexes squeezed higher high, and after that they are following the paths which I have shown - US indexes lower, CAC/DAX sideway move wave 4. If you look at the bigger picture it is more of the same from the last seven months - choppy three waves moves.
I was not interested about the Greek theater in the last six months, but now we are in the final stage and the news could alter the short term moves, but not the bigger picture.
The news so far look bad, the charts are not bullish either. US indexes - I think any move higher will be only a retracement and European indexes have finished or will finish an impulse and move lower should begin. How low? it depends on how scared the market participation will be about the "Greek drama". The more bearish scenario for US is lower low around 2065 double zig-zag, Europe lower low for a triple zig-zag(see previous post).
I do not see signs for a top, cycles and market breadth are pointing rather to a bottom than a top. So I expect any weakness to be short living before moving higher for the final top. I will be very surprised if the the top is behind us.... DO NOT FORGET it is not the time to be complacent, topping process is running for months it is time to pull your money out of the market on a rally and not looking for profits.
TECHNICAL PICTURE
Short term - with the news around Greece the red scenario looks now more probable.

Intermediate term - there is many different interpretation of the wedge..... it is better just to follow it's development until we see signs of a top. I do not see such at the moment. Three waves higher and lower.... when it is finished you will see a strong impulse lower.

Long term - significant correction after the move higher is over. Target - MA200/the support zone/the start of the wedge.

MARKET BREADTH INDICATORS
The Market Breadth Indicators - market breadth is hinting that we are close to a bottom(short term bottom).... but long term the first cracks are visible(see last two). Only 50% of all stocks are above MA200 when the indexes are close to their ATH(the move higher is not broad based) and cumulative AD is not following the indexes higher for the first time in years.
McClellan Oscillator - I expect to see a divergence on a new low for the indexes
McClellan Summation Index - sell signal.
Weekly Stochastic of the Summation Index - sell signal but oversold waiting for a bottom.
Bullish Percentage - sell signal.
Percent of Stocks above MA50 - in the middle of the range...
Fear Indicator VIX - long term higher lows... wedging too.
Advance-Decline Issues cumulative - I expect divergence when the indexes make the final high.
Percent of Stocks above MA200 - does not keep pace higher with the indexes.
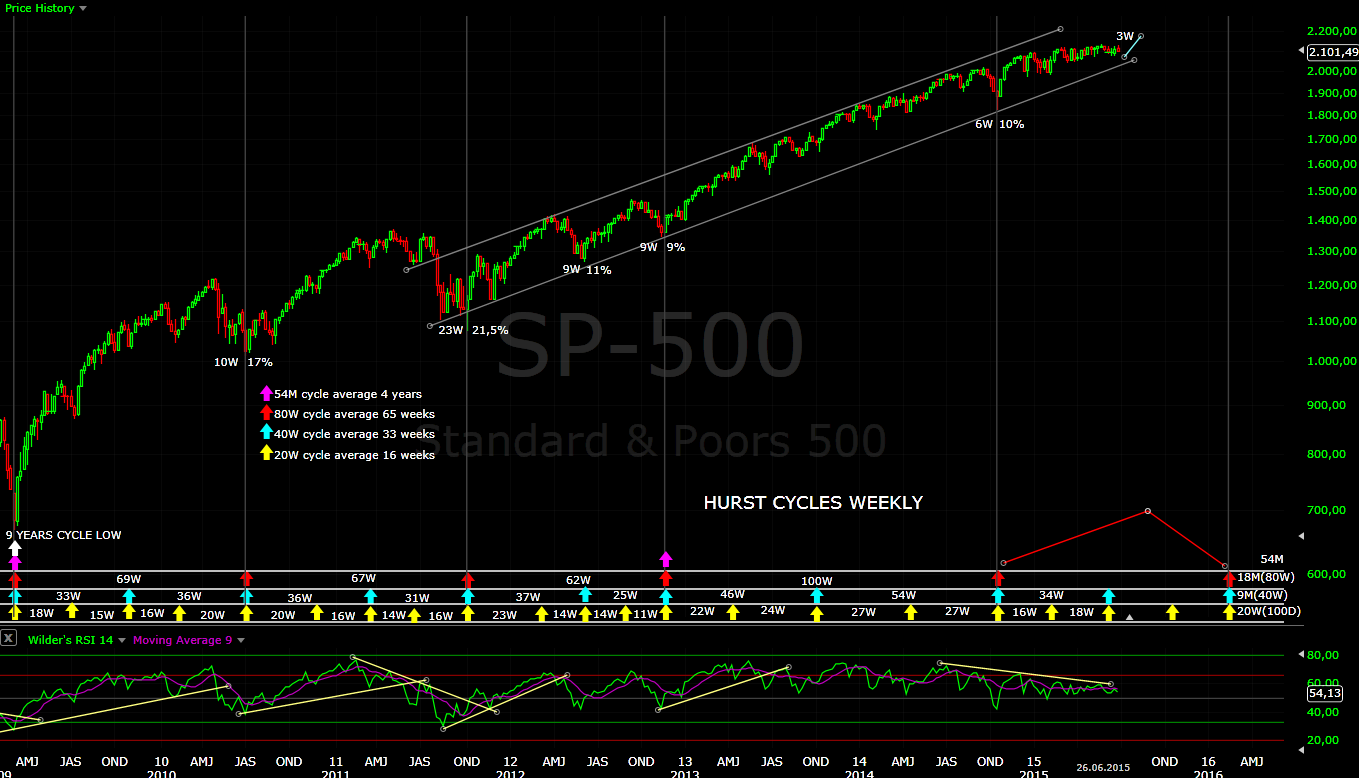
HURST CYCLES
Day 13 of the current cycle.

Week 3 of a new cycle, but if we see a new low we will move the low for the 40 week cycle and reset the count.
Tom Demark SEQUENTIAL AND COUNTDOWN - this technique spots areas of exhaustion.
Another price flip lower this time nothing interesting.... because of the extremely choppy moves in the last seven months TD Sequential does not help us much.

No comments:
Post a Comment