Trading trigger - buy signal, overdue for a top.
Analysis - long term sell the rips, we have major top. Intermediate term high next week and lower for 2-3 months.
P.S. - for a trade both analysis and trigger should point in the same direction.
TECHNICAL PICTURE and ELLIOTT WAVES
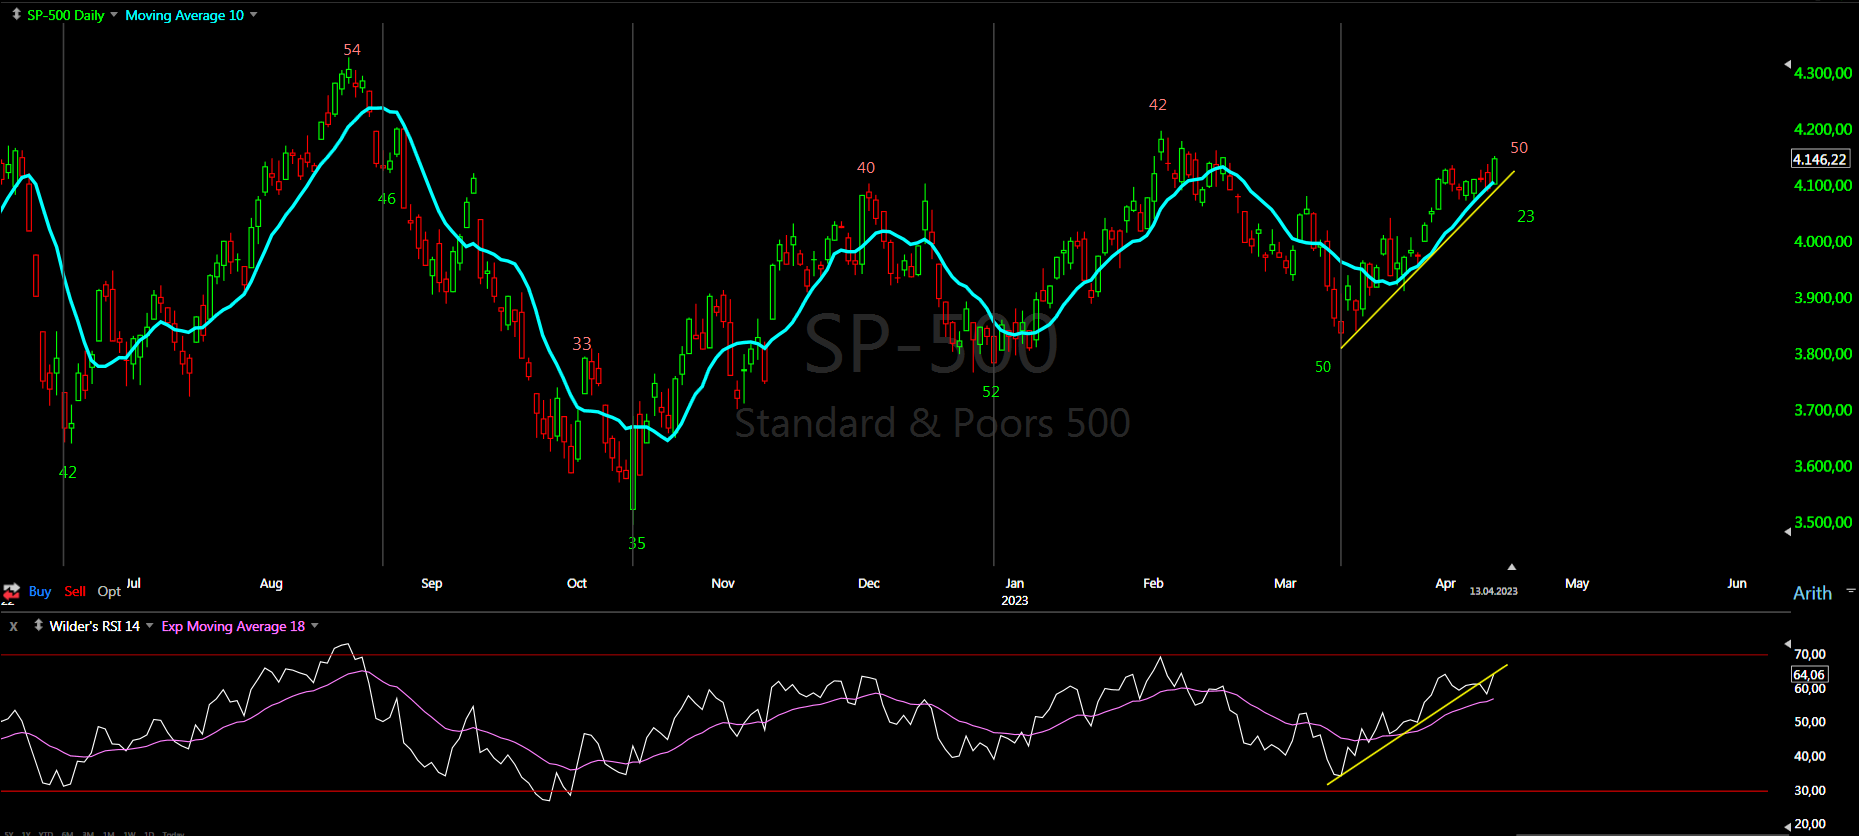
Short term - this wave up looks like impulse which fits with w-x-y zig-zag+flat.

Intermediate term - I think the indices are close to the top of the correction. It is a complex pattern there is different possible combinations and I am not sure where the B-wave starts - in June or October.

Long term - most likely huge double zig-zag from the 2009 low B-wave was completed and multi year decline has started. If we are lucky it is lower degree b-wave.

MARKET BREADTH INDICATORS
Market Breadth Indicators - the same pointing higher.
McClellan Oscillator - lower high after overbought level.
McClellan Summation Index - buy signal.
Weekly Stochastic of the Summation Index - buy signal.
Bullish Percentage - in the middle of the range.
Percent of Stocks above MA50 - in the middle of the range.
Fear Indicator VIX - heading lower, another test of the long term trend line.
Advance-Decline Issues - close to overbought levels.
HURST CYCLES
Short term cycles - looks like 5w low this week and continuation higher.... expect M shape top.

Week 5 for the 20w cycle. This is week 19 for the 20w cycle high and week 35 for the 40w cycle high - the average is 16-18/32-36 weeks so the indices are in the time window for a high.
Do not exclude the option for 18m low in June.2022 - in this case final sell off is imminent and 4y cycle low in September/October.


Thank you very much for the earlier-than-normal posting of your weekly update, Krasi. Very helpful to have prior to the markets closing for the week. Cheers.
ReplyDeleteWhat do you mean by this - "Week 5 for the 20w cycle. This is week 19 for the 20w cycle high"
ReplyDeleteWeek 5 for the 20w cycle - low to low. In theory there is only cycles counting low to low and this is the "normal" cycle - 20w or whatever.
DeleteI use high to high too - 20w cycle high for example.
A very boring week in the trenches. Cue the crickets ...
ReplyDeleteKrasi, any updated thought?
ReplyDeleteThe current 20d cycle looks right translated so in theory after a pullback we should see higher high or least to be tested like in December/February.
DeleteIntermediate term the pattern and cycles feel like important top.
Current thoughts:
ReplyDeletePattern - https://invst.ly/-tegw
Cycle - https://invst.ly/-tei0
The triangle b-wave will complete 20d cycle low.
One more push higher c-wave 20d/5w cycle high - most likely top of a higher degree too.
Krasi, it's not open
ReplyDeleteLady S is not bullish on those links
ReplyDeleteDuring March, US money market funds had greatest weekly outflow since 2020 ... right on time.
ReplyDeletePaying tax bills, jumping in on the bull run to the moon, struggling with cost of living, .... ?
DeleteInstead of "March" above, instead, the week ending April 19th
Delete