Short term - a mess for more than a month. The usual double zig-zag or impulse with very long sideways 4th wave? Judging by the last few years it should be zig-zag.

Intermediate term - next should be b-wave. In red the alternate bearish scenarios wave 5 or flat c/Y.

Long term - wedge(from 2020) for c/B at 9y cycle high 2000-2007-2015-2025.

MARKET BREADTH INDICATORS
Market Breadth Indicators - topping with divergences.
McClellan Oscillator - around zero.
McClellan Summation Index - sell signal.
Weekly Stochastic of the Summation Index - sell signal.
Bullish Percentage - turned lower with divergence.
Percent of Stocks above MA50 - topping with divergence.
Advance-Decline Issues - in the middle of the range with divergence.
Fear Indicator VIX - bottoming with divergence.
HURST CYCLES
Short term cycles - next week we should see 20d high and very likely 20w high.
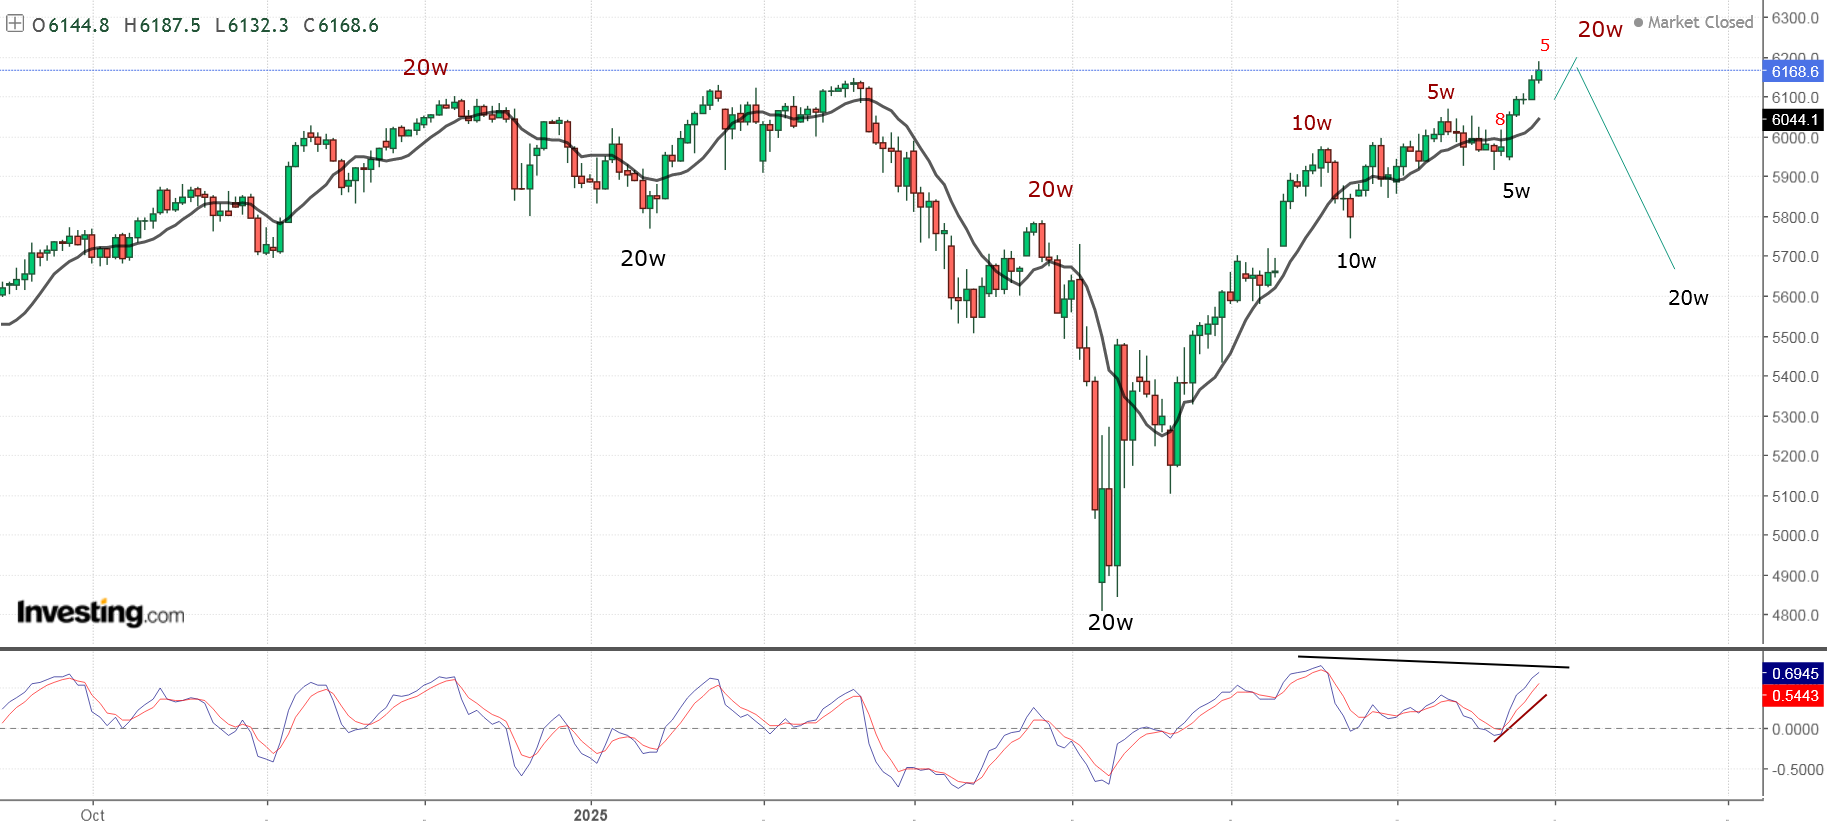
Long term cycles - possible 40w high next week.


Krassi, the dollar break the long term channel, under 97.5 they kill the dollar, that because the market go up , it's depends on the dollar, can you give us your thoughts for the dollar?
ReplyDeleteStrong buy, 4 years after the previous high, 7.5 years from the top X, pattern looking like bearish flag - https://invst.ly/1b77un
DeleteThanks
ReplyDeleteKrasi, I see a down trend from 1985 to 2001 to 2022, so if the dollar go up, and I'm skeptical, 110 is limited
ReplyDelete1985-2008 zig-zag lower now correction higher and the pattern is not completed - 61,8 retracement is roughly 125
DeleteNot to mention very likely major 18y cycle low is possible 1992-2008-2025
DeleteThe only caveat is if we will see one more low 3 years later like echo 1992-1995/2008-2011/2025-2028 before the blow off top of the correction... after that the USD can die but not before that.
“The only caveat is if we will see one more low 3 years later like echo 1992-1995/2008-2011/2025-2028 before the blow off top of the correction...” This is how the move is going to develop imo
DeleteThe dollar is weak because of the repo market, look at the M2, they want to kill tha dollar else they'll colaps the market, they have no choice, that because the market is so strong
ReplyDeleteLook at long term NDX, go up of channel, what your thinking?
ReplyDelete