The indices transition from up to down next is decline for a few weeks and 20w low. After that one more up move into September/October.... and major top completing the move from 2009. Enjoy the summer after that it will not be very funny.
For the next several weeks I will post only quick updates.
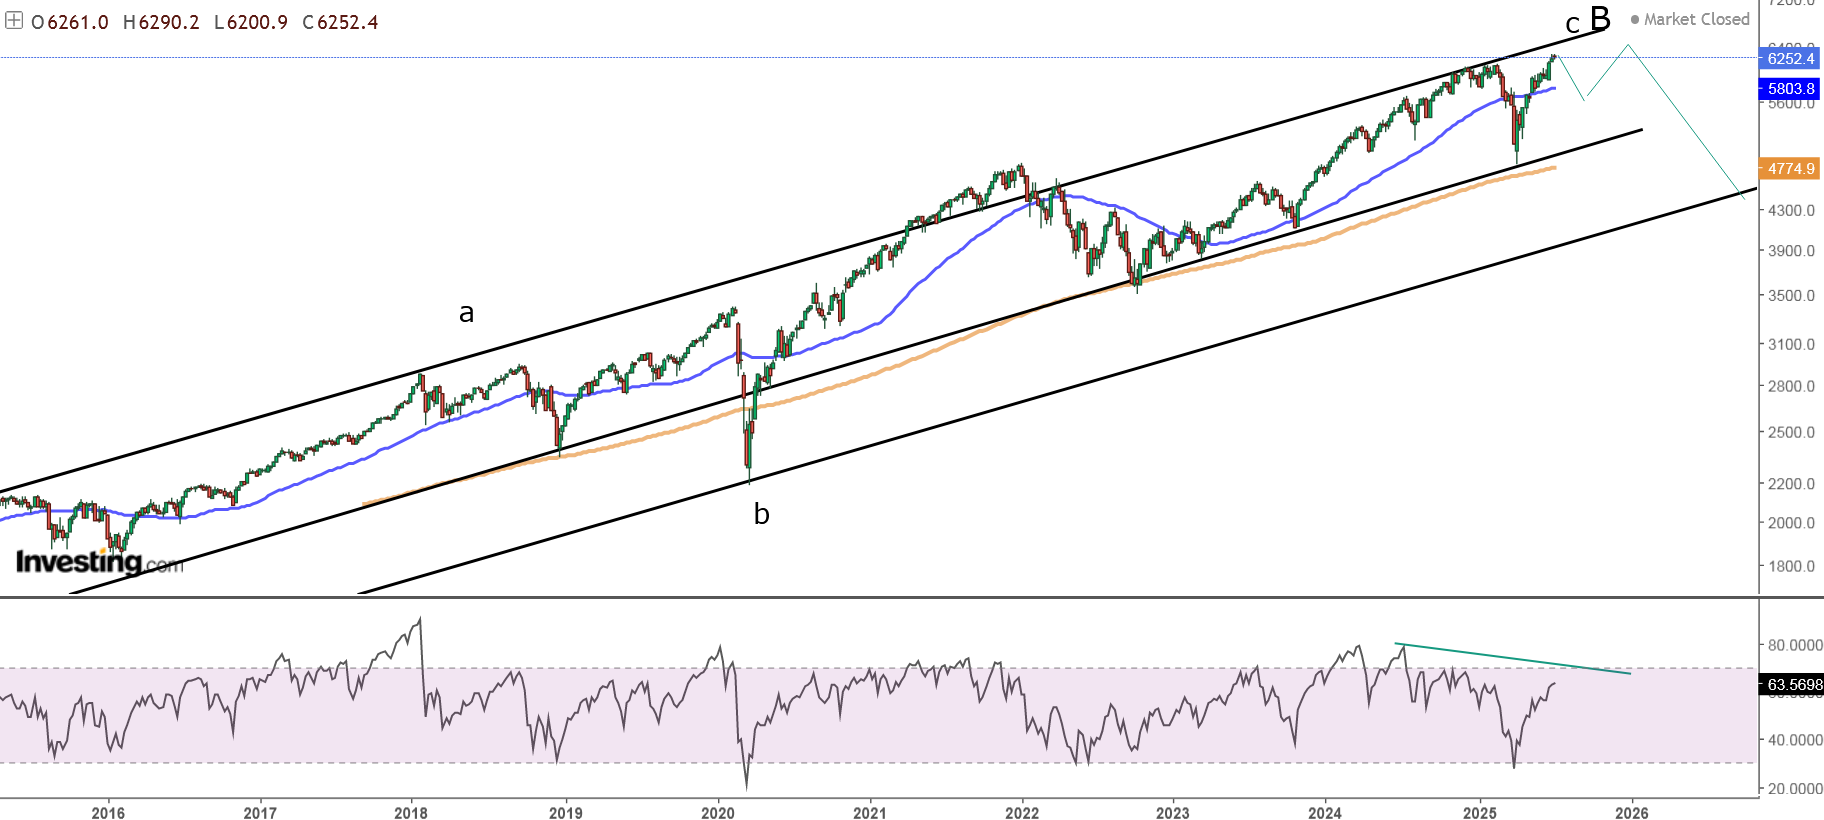
TECHNICAL PICTURE and ELLIOTT WAVES
Short term - turning lower, too early to project a pattern. 38% Fibo retracement is around the previous important low for the X-wave.
Intermediate term - next should be b-wave. In red the alternate bearish scenarios wave 5 or flat c/Y.
Long term - wedge(from 2020) for c/B at 9y cycle high 2000-2007-2015-2025.
MARKET BREADTH INDICATORS
Market Breadth Indicators - turning lower and divergences.
McClellan Oscillator - around zero and divergence.
McClellan Summation Index - buy signal.
Weekly Stochastic of the Summation Index - buy signal.
Bullish Percentage - divergence.
Percent of Stocks above MA50 - turned lower.
Advance-Decline Issues - turned lower with divergence.
Fear Indicator VIX - bottoming.
HURST CYCLES
Short term cycles - transition from 20w high to 20w low.
Long term cycles - looking at other indices and shares primarily the tech sector(it drives the market higher) the cycle model for the highs which looks best is the one shown below. It fits with the lows, makes 4y cycle high a month or two short of 4 years so it looks good.
I will follow this one, the difference is shifting the count with one 20w cycle high to the right.