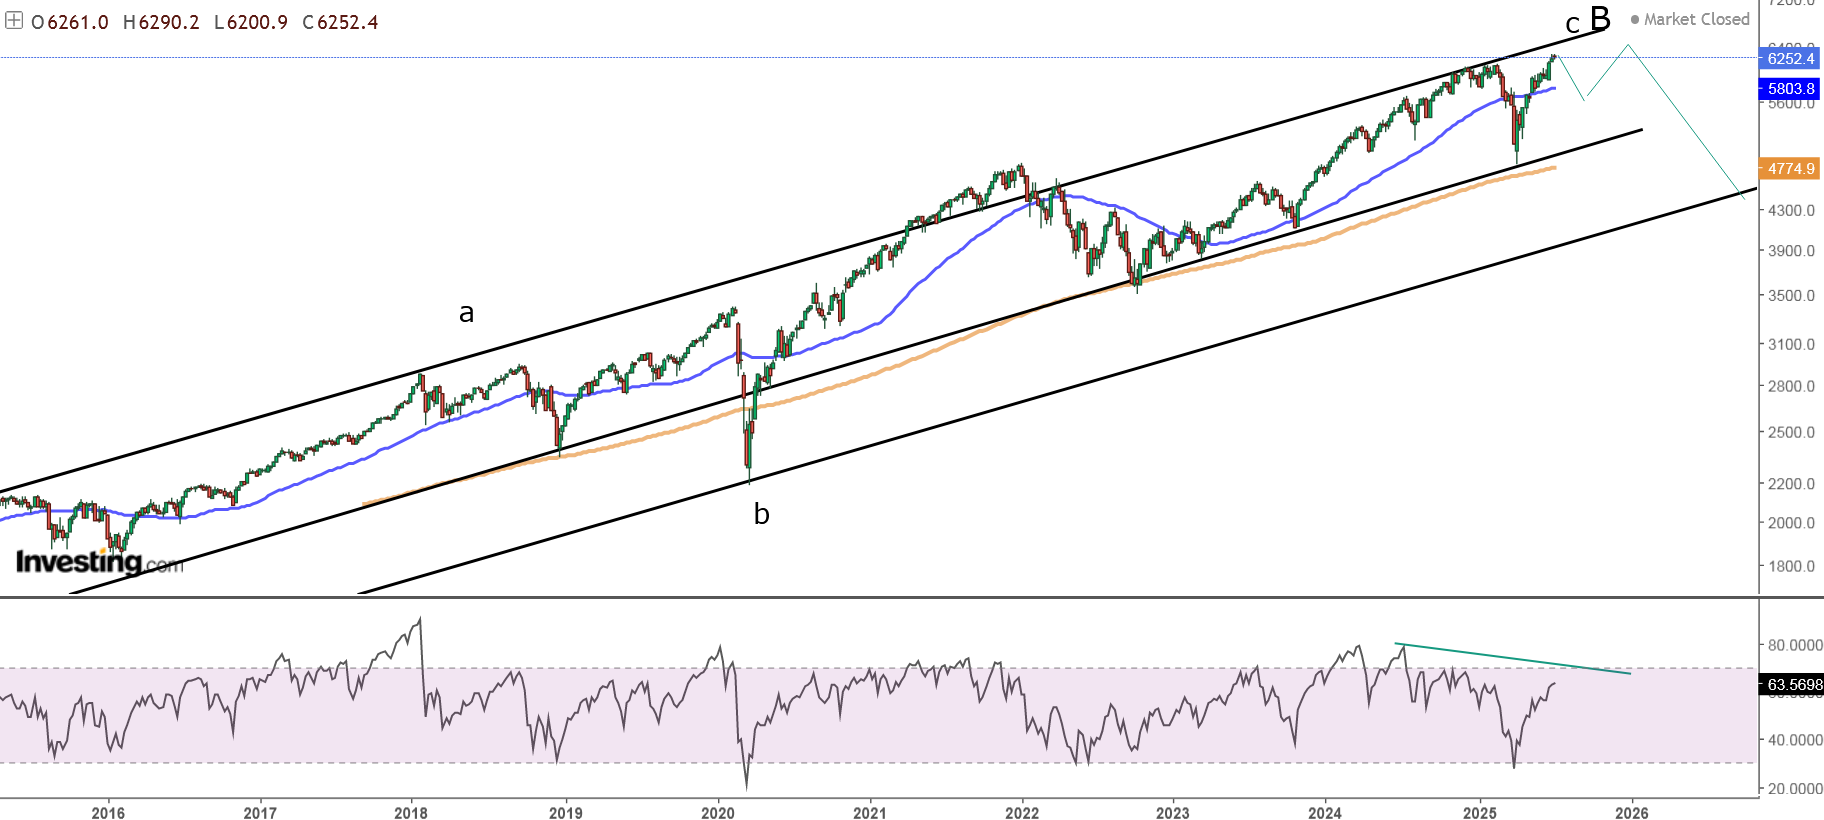
Short term - turning lower, too early to project a pattern. 38% Fibo retracement is around the previous important low for the X-wave.

Intermediate term - next should be b-wave. In red the alternate bearish scenarios wave 5 or flat c/Y.

Long term - wedge(from 2020) for c/B at 9y cycle high 2000-2007-2015-2025.
MARKET BREADTH INDICATORS
Market Breadth Indicators - turning lower and divergences.
McClellan Oscillator - around zero and divergence.
McClellan Summation Index - buy signal.
Weekly Stochastic of the Summation Index - buy signal.
Bullish Percentage - divergence.
Percent of Stocks above MA50 - turned lower.
Advance-Decline Issues - turned lower with divergence.
Fear Indicator VIX - bottoming.
HURST CYCLES
Short term cycles - transition from 20w high to 20w low.

Long term cycles - looking at other indices and shares primarily the tech sector(it drives the market higher) the cycle model for the highs which looks best is the one shown below. It fits with the lows, makes 4y cycle high a month or two short of 4 years so it looks good.
I will follow this one, the difference is shifting the count with one 20w cycle high to the right.


May be 23 June 10w low ?
ReplyDeleteYes it is possible - the bottom of bigger x-wave(first chart)
DeleteLooking the DAX this makes sense - https://invst.ly/1bdlj0
DeleteKrasi, the EUR go up of the line form 2008, it looks like we are going to Chak the line and go up a lot , if so the dollar will break down the channel that looks like bear flag and so the market will go up a lot, they print a lot of money
ReplyDeleteWrong
DeleteLook the M2
ReplyDeleteThis price action is more bearish because the pattern starts looking like this - https://invst.ly/1bdlve
ReplyDeleteIn this case the cycle is 40w high next week at 33 or the week after that 34.... right on schedule between 32-36 average.
Krasi, do you have the EUR long term channel?
ReplyDeletehttps://invst.ly/1bh7do
DeleteMarket looks like it will extend its gain until earnings next week. Good luck.
ReplyDelete