The past week DJ rose 70,28 points(+0,64%) and DAX 14,14 points(+0,23%).
The big picture has not changed you can see the weekly charts and my longer term view in the previous weekly review from 03.04.2010.
Therefore I will show this week short-term charts - daily and hourly
I have expected higher prices and DJ to hit 11000 - exactly that happened exactly to the point.... what a surprise:)
So we have more and more bearish signs, but the indexes are rising further.... it is not over until its over - it is that simple:)
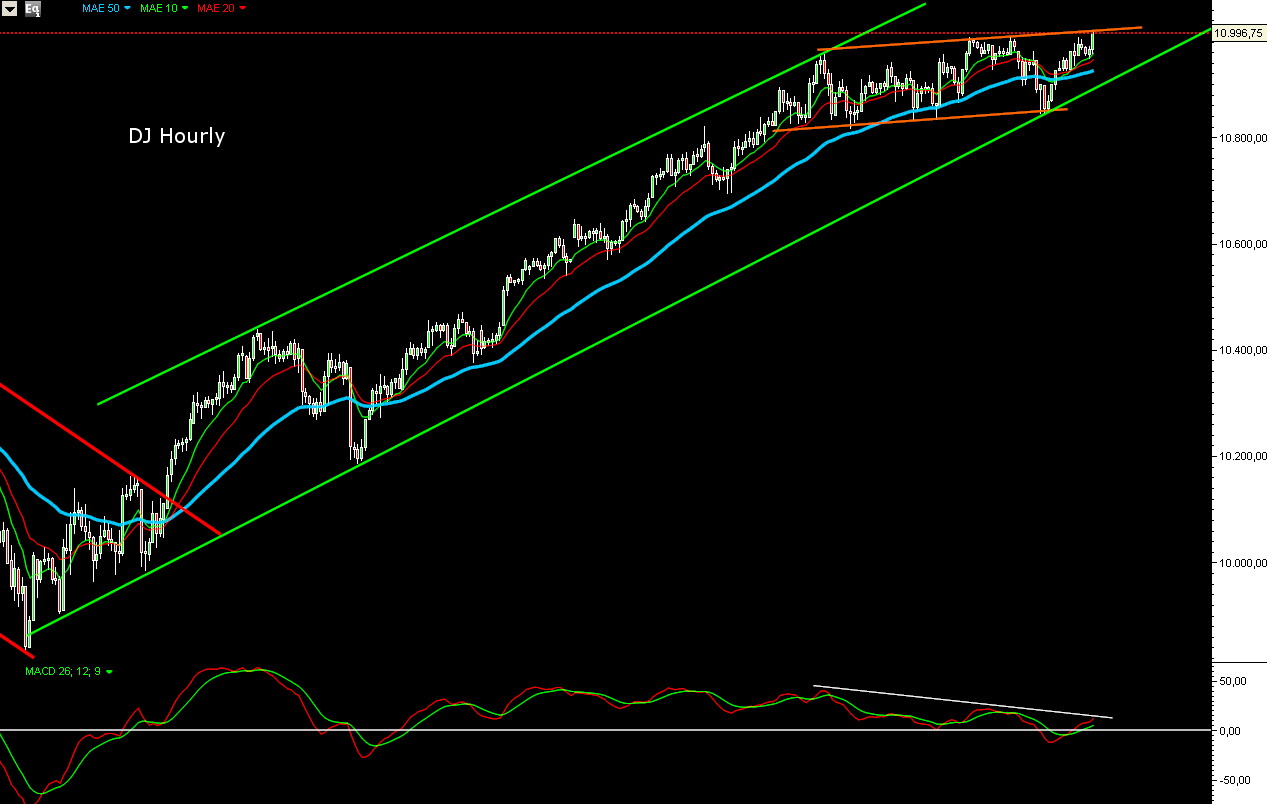
Look at the charts bellow:
On the hourly charts - prices are rising and they are above EMA50, short-term EMAs EMA10 and EMA20 are above EMA50, MACD is above the zero line(yes developing divergence but still above 0 and rising).
On the daily charts - yes we have possible divergences but there is NOT confirmed bearish candlestick, there is NO confirmation from the short-term charts(hourly).
I expect on Monday (the magic day we always have a rally on Monday) the indexes to close higher, for the rest of the week... it is difficult to predict at this point. My best guess is that the pullback will start next week, but you know - it is not over until its over:) So watch the hourly charts they will tell the story. I have marked on the charts the levels, which will trigger short trade and the most probable targets.
Yes we will see higher prices next week, but long positions are very risky now. Do not get too bullish. The indexes have some room to rise, but they will hit rising resistance(see daily charts) and multi year resistance(see previous week the weekly charts). With this technical picture and market breadth indicators I do not expect a rally. Right now I am on the side line and wait for a short signal. If the indexes rise further... ok but no thanks without me:)
P.S. On the Dow and the DAX the divergences are not so well defined but look at DJ Transportation, Nasdaq and Russell - the picture is much clearer.
Pullback target is ~10550 which is the trend line since the March 2009 bottom, support level from the December range and MA50 - strong cluster of support. If the pullback is very deep second target is ~10250 which is the low level of the December range and MA200.

More than two weeks sideway move carved out channel on the hourly chart. It does not look like a top, so I expect higher prices before the index break through the channel.
Pullback target is ~5850-5900 which is the trend line since March 2009 bottom, the October and November highs and MA50 - again strong cluster of support. If the pullback is deep the second target is the neckline of the reverse Head&Shoulders around 5750.

We could see a Double top or the prices could hit the upper line of the wedge and carve out Head&Shoulders topping pattern at the hourly chart.

The trend on Russell, Nasdaq and DJ transportation looks tired. I think this move is coming to an end.


No comments:
Post a Comment