Jan 27, 2019

Weekly preview

Nothing new to add, I still think the markets are topping. Waiting for confirmation if we have a top or one final high with divergences. After that expect a-b-c lower around mid-February.


TECHNICAL PICTURE and ELLIOTT WAVES
Short term - the move higher looks like a-b-c, but we need reversal lower next week for confirmation. According to RSI this is the final move. We could see higher high with divergences to test the trend line, but that is all.


Intermediate term - the trend line is tested for the second time. Even if we see one final higher high it will be short living and create divergences. Break outs did not occur with overbought indicators and divergence. Pullback to reset the indicators and then break out.


Long term - wave B running for IV from 2009. Possibilities are simple zig-zag or triangle to burn time.


MARKET BREADTH INDICATORS
Market Breadth Indicators - the oscillators turning down from very extended levels, the trend following indicators with buy signal.
McClellan Oscillator - extremely overbought and double divergence.
McClellan Summation Index - buy signal.
Weekly Stochastic of the Summation Index - buy signal, reached the overbought level.
Bullish Percentage - buy signal.
Percent of Stocks above MA50 - reached the 75 level and making a pause.
Fear Indicator VIX - we should see a move higher for the VIX and lower for the indexes.
Advance-Decline Issues - turned lower.


HURST CYCLES
Day 21 for the 40 day cycle.


Week 5 for the 20 week cycle. Shorter cycles possible 40 week low in Dec.2018 so we will keep an eye how fast the pattern develops.

Jan 19, 2019

Weekly preview

I was expecting something around resistance 2620 for c=a, but we saw spikes on Thursday and Friday. Now we have c=1,23xa and for c 5=0,618(1to3) common target for the fifth wave. Every index and share I look at shows complete pattern... so I think the indexes are close to a top. I was expecting turn date around MLK day and I thought it will be a low, but now it is obvious it will be a high. Next we should see topping and at least 50% retracement, but I think it will be more like 61,8%.

The big picture a-b-c for B higher running. Last week I explained in details what I see so nothing new to add. Now all indexes joined the NDX and overlap with the previous waves... I do not know how to twist this bearish and count major top.


TECHNICAL PICTURE and ELLIOTT WAVES
Short term - some counting impulse, I think a-b-c fits better. At the end the outcome will be the same. Despite the spikes on Thursday and Friday the pattern is still valid and shows common Fibo measurements - at the same levels you have the target for wave 5 and on higher degree c=1,23xa.


Intermediate term - I expect something like in March.2018. The price should spend time below MA200 topping - lower 100 points to support, retracing more of the decline and bigger leg lower to retrace 50%-61,8% of the whole rally for b/B.
RSI very steep advance this is not sustainable and it should cool off.


Long term - wave B running for IV from 2009. Possibilities are simple zig-zag or triangle to burn time.


MARKET BREADTH INDICATORS
Market Breadth Indicators - the oscillators very overbought so it is time for a pause.
McClellan Oscillator - very overbought with divergence.
McClellan Summation Index - buy signal.
Weekly Stochastic of the Summation Index - buy signal.
Bullish Percentage - buy signal.
Percent of Stocks above MA50 - in the middle of the range .
Fear Indicator VIX - one push to 25 and lower again.
Advance-Decline Issues - very overbought with divergence.


HURST CYCLES
Day 17... a good time for a short term high and decline for mid-cycle low.


Week 4 for the 20 week cycle. Shorter cycles possible 40 week low in Dec.2018 so we will keep an eye how fast the pattern develops.


Tom Demark SEQUENTIAL AND COUNTDOWN - this technique spots areas of exhaustion.
Sell setup completed and this time I think it will be really a sell.

Jan 12, 2019

Weekly preview

It takes too long and I think this move is of the same degree as the September-December decline and not part of it. The implications:
- short term - deep retracement, but no lower low. To the upside it is only a zig-zag which is corrective pattern so it is part of much bigger corrective wave higher - conform to my expectations for multi month B wave.
- the big picture - for a major top and reversal you need impulse lower, for a top in January.2018 you need an impulse for wave C too. With a corrective zig-zag lower(September-December decline) both options look dead to me - conform to my expectations for a-b-c/IV from 2009 running.

If you step back and look at the charts you will see - NDX/RUT two legs lower with the same size, DJ two legs lower with almost c=1,618xa, SPX/NYSE with an unusual but still Fibo proportions c=1,382xa. Short said my preferred scenario is playing, just got confused with the unusual proportion and the corrective begin of the reversal. It is difficult to see impulse lower and NDX is overlapping already so the odds for another lower low are very low.
With or without lower low the next decline is the buy opportunity for those who trade longer time frames or look for low risk entry.

How could the pattern look like? - Expect B wave for a few months. The price is moving fast and if it continue with this speed shorter cycles and important low in July-August time window(the last chart). Another option is the market to calm down and burn time with slowly moving B wave like in 2018 six months or triangle.
You can not predict how fast or choppy a corrective wave will be so just watching how it develops in the next months.


TECHNICAL PICTURE and ELLIOTT WAVES
Short term - I see a zig-zag and a lot of resistance. The next leg should be a deep retracement, but higher low. RSI still holding the trend line, but it looks like it is building a divergence. The micro count is difficult, there is no clear 1-2 waves, but I think the fifth wave of (c) is running with final high on Monday


Intermediate term - the price is testing resistance and MA50, RSI/MACD the trend lines. We should see one more push lower before break out. This will confirm that my preferred scenarios is running and we are in the middle of wave IV from 2009.


Long term - some kind of zig-zag for wave B expected. It could be part of a bigger correction or alternate triangle to burn time.


MARKET BREADTH INDICATORS
Market Breadth Indicators - buy signals and some extremely overbought.
McClellan Oscillator - extremely overbought level.
McClellan Summation Index - buy signal.
Weekly Stochastic of the Summation Index - buy signal.
Bullish Percentage - buy signal.
Percent of Stocks above MA50 - in the middle of the range.
Fear Indicator VIX - lower high around 25 expected.
Advance-Decline Issues - extremely overbought level.


HURST CYCLES
Day 12 for the 40 day cycle. It seems we had longer 20 week cycle consisting of three 40 day cycle instead of two.


Week 3 for the 20 week cycle. This is the model with longer cycles. In this case the price should burn a lot of time very long B wave or triangle.


Alternate is shorter cycles and zig-zag/flat which does not stretch in time. Wave A lasted three months for B/C 3-4 months each and a low in July-August.

Jan 5, 2019

Weekly preview

We did not saw continuation lower on Monday and it was obvious that something else is going on because it takes too long. It was suspicious from the beginning - 5% in one day is too much for a wave of such degree. I see two options this is wave b/C or the decline is over and the bottom will be tested with higher low. Looking at many indexes and shares it just feels like something is missing. The pattern does not feel completed and one final lower low will look much better than higher low.

Enough theory make a step back, look at the big picture and think about trading - in the next 2-3 weeks we should see some kind of consolidation/bottoming and reversal higher with or without lower low. Time to think about exit strategy for shorts and long trades.


TECHNICAL PICTURE and ELLIOTT WAVES
Short term - I see zig-zag higher for a and flat for b now c running. Target is 2550 c=0,618xa and the April.2018 low as resistance. Extension to 2575 is ok 50% retracement of the December sell off. Anything above that and the probability is higher that the bottom is in.
If I am wrong we will see higher low and fractal similar to April.2018 reversal beginning with a zig-zag.


Intermediate term - the same patterns on the daily chart. The resistance zone around 2550 should be tested and if it holds or not will tell us what is going on. So far no confirmation for reversal - no impulse, the price is below resistance, below MA50, RSI just trying to test the trend lines.
At first glance if we see one more low it counts like impulse from the September high(5/C/IV green) - I think this is wrong. Looking at RSI it is neither w4 from the December high nor w4 from the September high. I Think we have second zig-zag(my initial pattern) but bigger with 1,618 Fibo measurement.
Alternate this second leg lower and the whole pattern is finished. The bottom is in with pattern similar like April 2018(the circle) - higher with zig-zag, but mirrored in April the second leg of the zig-zag was the strong one now the first leg is the longer one.


Long term - corrective A-B-C is running and the question is when it has begun in January(green) or September(red). I prefer the red scenario - time(cycles) and pattern fit better.
RSI looks exactly like the a-b-c January-April.2018 and I think we have one more leg lower with divergence for another a-b-c/A and not an impulse.


MARKET BREADTH INDICATORS
Market Breadth Indicators - turned up, some with buy signal, but it is more likely to see consolidation/bottoming and divergences before we see strong buy signal with low risk.
McClellan Oscillator - very strong move above zero after extreme oversold levels now very overbought.
McClellan Summation Index - turned up, buy signal.
Weekly Stochastic of the Summation Index - sell signal, in oversold territory.
Bullish Percentage - turned up, buy signal.
Percent of Stocks above MA50 - turned up.
Fear Indicator VIX - turned lower, most likely we will see a divergence and buy signal.
Advance-Decline Issues - strong move up, most likely we will see a divergence and buy signal.


HURST CYCLES
Day 27 for the daily cycle, another 2-3 weeks and lower low will look perfect for 40 day cycle low.


Week 10 for the weekly cycle, another 2-3 weeks and lower low will look perfect for the expected shorter 20 week cycle.

Jan 2, 2019

Long term - update

Happy New Year!!!!


I wish you successful new year and good luck trading in 2019, I think we will need it:)


The current view for the next 6 months:
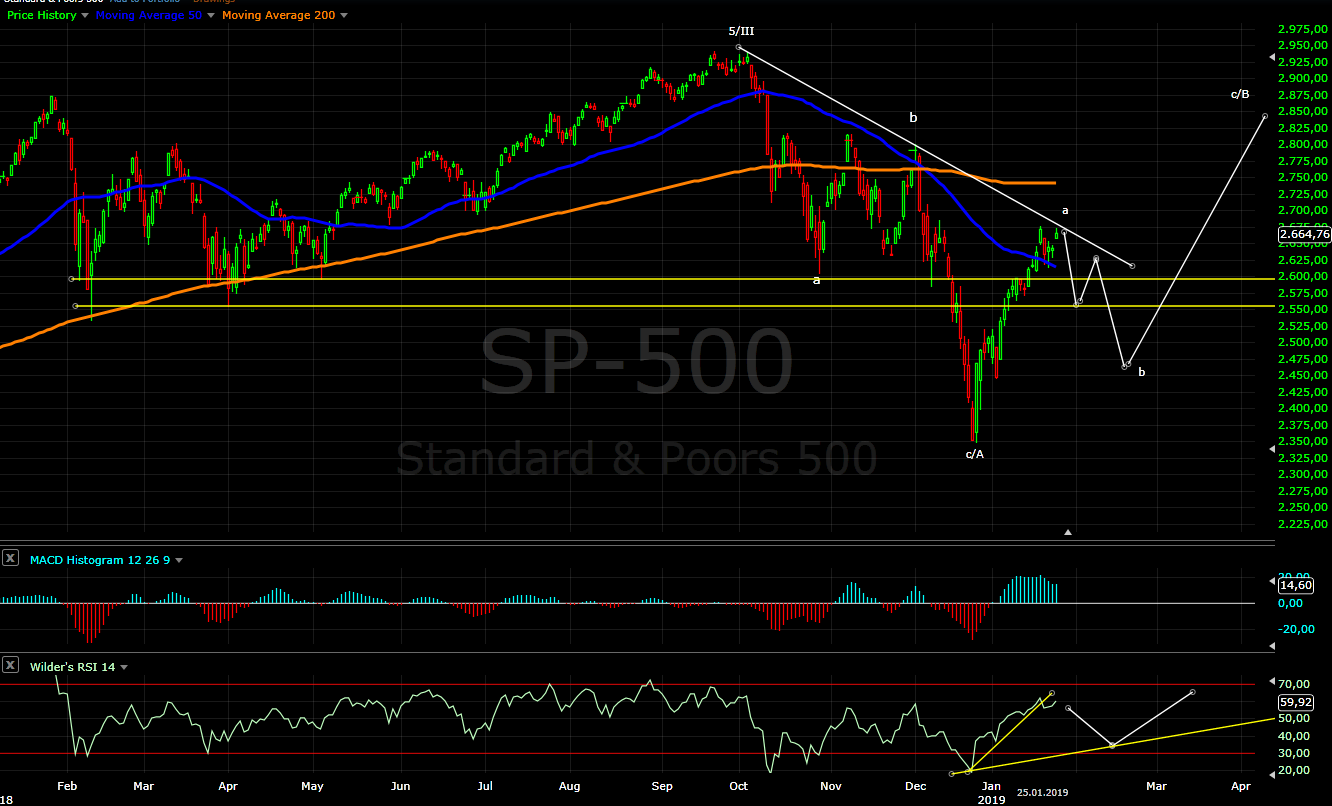
- Stocks - intermediate term low expected and multi month rally.
- Bonds - multi month corrective move higher.
- USD - another leg higher to finish corrective move which begun in Feb.2018.
- Precious metals/miners - 4 year cycle low in Q2 and the begin of nice rally higher.
- Crude Oil - corrective wave B higher in the next months.


- STOCKS
I think we have the expected 4 year cycle high and a big correction is running. Next we should see an intermediate term low in January and multi month rally. When it is over another scary decline for 4 year cycle low in late 2019 or Q1.2020.
Alternate we have shorter 4 year cycles(both high-to-high and bottom-to-bottom) and the high was in January 2018 followed by a correction roughly one year for 4 year cycle low in the next few weeks.


- BONDS
I thought we have big sideway pattern with another zig-zag higher to follow, but with a quick plunge for two months we have bigger A-B-C from the top and 2 year cycle low. In the next months bonds should move higher. Watch RSI it should reach the trend line.


10 year yield - the move from the low looks like finished A-B-C and in the next months they should drop lower. RSI - double divergence and broken trend line, the move up should be over.


- FOREX
Long term USD made 16 cycle high the end of 2016 and should move lower in the next several years.

Intermediate term we have counter trend moves and such is running at the moment. USD finished the impulse most likely short wave B and C is running.

JPY after 2 year cycle high and decline, now we should see 4 year cycle low in 2019 followed by strong rally for 8 year cycle high in 2020. It has very high correlation with Gold and this are the same cycles.

USD/JPY - I think we have shorter 4 year cycle and I have adjusted the yearly cycles. If the count is right we should see a low in a few weeks and final move higher. EW pattern similar like gold miners - wave c to finish wave B flat correction or something more complex for B like triangle. We will know when we see the decline and the low in 2020.


- GOLD/SILVER/MINERS
No surprises - we saw a decline and intermediate term low earlier in September... since then choppy move up. I doubt this is important low. I think we will see one more decline next year for important 4 year cycle low. Currently I am watching the month of May as possible bottom, but I will not be surprised if the bottom is "stretched" April-June - not synchronized bottoms for gold miners/gold/silver like 2015/2016. The pattern is taking shape and I this should be a nice trading opportunity - 4 year cycle low followed by a strong rally into Q1.2020 for 8 year cycle high.

GOLD - the expected decline was very fast and made a low in August earlier as expected this is the "surprise". I think gold should turn lower for the final decline and 4 year cycle low.


SILVER - last time I wrote that is already too late in the cycle for a rally and we saw a decline. Now I think it is too early for an important low(4 year cycle low). The first 2 year cycle was shorter 19 months so the next one should have at least the average length 22 months which is another 5 months or May 2019.


MINERS - the obvious outcome should be strong wave C(green) like the first half of 2016. The bearish case is wave b/B for much complex wave B(red) or a triangle(yellow). In both cases this is a good trading opportunity.


- CRUDE OIL/NATGAS
Both moved in the expected direction, but really crazy moves... I do not think you can forecast something like that before you see it developing.

Crude Oil - important high on time hitting the trend line(see below) and relentless decline without a pause. Next we should see a retracement for wave B and one more leg lower.

Alternate cycle view with Benner cycles 11-10-7 years explaining the irregular long cycles and relative regular 3-4 year cycle. Most EW guys are counting wave 3-4 and 5 has begun. I think we have huge A-B-C and now corrective a-b-c for X is running. Another zig-zag lower should finish the secular bear market. This is arithmetic scale on logarithmic scale the second A-B-C is equally big like the first one.


Natgas - I was expecting something like this(all previous important highs were sharp moves higher), but next year not now. We need one more up and down for impulse to confirm a major top.