Oct 31, 2013
Signals
Short term signal: DOWN - it will turn up above 1768
Intermediate term signal: UP - it will turn down bellow 1740
Comment: Bounce from EMA50 on the hourly chart... and sell off in the last hour. Today is the last day of the month and the funds must show nice numbers, that is why not too much selling. Tomorrow I expect EMA50 to be taken out and a red day 10-15 points lower.
Oct 30, 2013
Signals
Short term signal: DOWN - it will turn up above 1770
Intermediate term signal: UP - it will turn down bellow 1740
Comment: Someone surprised????? The price is still above EMA50 on the hourly chart and above minor support, but with histogram divergence on the daily chart
and MACD divergence on the hourly chart the probability is higher, that we will see at least a pullback.
Watch price behavior for clues:
- bearish scenario intermediate term top - we will see a move bellow 1710
- bullish scenario short term top - pullback should stay above 1710
Levels to watch SP500:
- 1710 - minor support
- 1627 - support level
- 1597 - major support level


Oct 29, 2013
Signals
Short term signal: UP - it will turn down bellow 1759
Intermediate term signal: UP - it will turn down bellow 1740
Comment: Nothing interesting... red scenario from the hourly chart is playing out grinding higher... as expected up until FOMC
Oct 26, 2013
Weekly review
Short term view - up until FOMC
Intermediate term view - we should see an intermediate term top in the next week or two
Ok no pullback it was more a sideway move this week. The "more bearish" scenario so to speak, top at the upper wedge line is invalidated. I was a little bit skeptical because too many were watching the wedge already so the consequence usually is that the target is overshooted and that confuse most of the traders. Not that SP500 broke decisively above it but it is taking too long and with FOMC on Wednesday I do not expect a top before that. Remember the previous meetings? always a top or a bottom... spooky:)
Short term - I think FOMC will be a top, the question is short term or intermediate term top. I see two scenarios they are shown on the daily chart.
The big picture - you know my forecast already. The weekly chart first posted on 4-th.June almost 5 months ago - the circled areas are preceded by a rally which lasts longer and moves faster than the average one, this leads to excessive greed and its usually purged with sharp correction. The next move based on statistic and history should be 15%-20% correction. Cycles says this move should top in a week or two and correction for roughly 10 weeks should follow(see cycles bellow for explanation). Indicators - there is enough divergences to support such a move. Margin debt at record highs, I saw somewhere chart with mutual funds inflow - a lot of in the last several months, average Joe is back.
I was missing one ingredient - aggressive bullishness. Man this week going through the bloggs..... the bulls are everywhere and are very aggressive. After almost a year moving higher, WITHOUT a normal correction(8%-10%), everybody are great traders next stop 2000. If you mention a correction and you are an idiot, the FED is printing money bla bla nonsense, we will never see a correction any more, sentiment through the roof:) Investor's Intelligence bull ratio never dipped below 55% for over two years. Its currently back at 73%, the AAII bull/bear ratio is at whopping 73%. That is exactly what I want to see around tops.... if you ask me we have a green light for the correction.
This is the logic and the analysis above and now listen carefully - if the SP500 moves bellow 1740 you have a road map, BUT until than do like the bulls - party, sing "Kumbaya My Lord" and shout up-up-up to the Moooooon... have a great weekend:)
TECHNICAL PICTURE
Short term - I expect some kind of a top after FOMC. MA50 could be tested first for a flat correction, or just grinding higher... I do not know.
 - Triple cross(EMA10 and EMA20 crossing EMA50) - triple cross is positive, short term trend is up.
Intermediate term - The two scenarios which I see - FOMC is intermediate term top(green) and than a correction after a rally for almost a year begins, or FOMC is short term top(red) and there will be one more push before a correction.
 - Trend direction EMA50/MACD - the intermediate term trend is up.
- Momentum Histogram/RSI - momentum is up, short term trend is up.
Long term - The pattern is still intact, MACD is struggling not to break its trend line... the bulls should master strong rally to negate all divergences and the historical pattern.
We have a rally which lasts almost a year without a correction and I still think that this leads to excessive greed and the consequence is always a sharp correction to purge the greed from the system. This shows us the pattern and I do not think that this time is different. It is always the same and only the excuses are different.
 - Trend direction EMA50/MACD - long term trend is up - the price above MA50 and MACD above zero.
- Momentum Histogram/RSI - momentum has turned up, the intermediate term trend is up.
MARKET BREADTH INDICATORS
The Market Breadth Indicators - the same story, they look better buy signals, but the divergences are still there.
McClellan Oscillator - diverge at overbought levels...
McClellan Summation Index - buy signal, but still lower high
Weekly Stochastic of the Summation Index - still a sell signal.
Bullish Percentage - buy signal, but lower high and triple divergence.
Percent of Stocks above MA50 - overbought levels reached again. Short term and longer term divergence building at the moment.
Fear Indicator VXO - building a bottom... a looot of complacency again.
Advance-Decline Issues - overbought levels reached, expect lower high with divergence.
HURST CYCLES
The scenario that we already saw 20 week cycle low and we are currently in week 3 of the last one for this 18 month cycle has much higher probability after we did not see reversal last week.
Take step back and look at the big picture.... what we have till now? - three 18 month cycles. The first peaked at week 59 and we saw 10 weeks correction. This is late in the cycle, which is not surprise after severe bear market and 9 year low. The second one peaked at week 43 but the real correction started at week 53 and lasted 12 weeks. The third one peaked at week 51 and the correction lasted 9 weeks. To summarize - the last 20 week cycle peaked at week 59/53/51 and correction for 10/12/9 weeks has followed. I do not see a reason why this time should be different. We are currently at week 3 of the last 20 week cycle or in week 49 of the 18 month cycle. If the history repeats we should see a top in the next 1-2-3 weeks and roughly 10 weeks correction.
The daily chart did a great job again. At the moment we are at day 13. If I am right this 40 day cycle should top soon and a move lower into the second half of November should start.
I expect to see in the next several weeks the top of the last 20 week cycle the 40 week and 18 month cycle.
Look at the chat closely and make your own decision.... I think it is always the same and the history repeats.
Tom Demark SEQUENTIAL AND COUNTDOWN - this technique spots areas of exhaustion.
It looks like that the daily and weekly charts are peaking together. This is the strongest signal which you want to see at important top or bottom.
On the daily chart all counts has been finished this week. On the weekly chart 8 of the setup is almost sure and for 9 of the setup is not even necessary to make a new high.
 I think the setup will be finished and new ATH is not necessary. The weekly chart favors a little bit more the bullish scenario but it is not a must.

Intermediate term view - we should see an intermediate term top in the next week or two
Ok no pullback it was more a sideway move this week. The "more bearish" scenario so to speak, top at the upper wedge line is invalidated. I was a little bit skeptical because too many were watching the wedge already so the consequence usually is that the target is overshooted and that confuse most of the traders. Not that SP500 broke decisively above it but it is taking too long and with FOMC on Wednesday I do not expect a top before that. Remember the previous meetings? always a top or a bottom... spooky:)
Short term - I think FOMC will be a top, the question is short term or intermediate term top. I see two scenarios they are shown on the daily chart.
The big picture - you know my forecast already. The weekly chart first posted on 4-th.June almost 5 months ago - the circled areas are preceded by a rally which lasts longer and moves faster than the average one, this leads to excessive greed and its usually purged with sharp correction. The next move based on statistic and history should be 15%-20% correction. Cycles says this move should top in a week or two and correction for roughly 10 weeks should follow(see cycles bellow for explanation). Indicators - there is enough divergences to support such a move. Margin debt at record highs, I saw somewhere chart with mutual funds inflow - a lot of in the last several months, average Joe is back.
I was missing one ingredient - aggressive bullishness. Man this week going through the bloggs..... the bulls are everywhere and are very aggressive. After almost a year moving higher, WITHOUT a normal correction(8%-10%), everybody are great traders next stop 2000. If you mention a correction and you are an idiot, the FED is printing money bla bla nonsense, we will never see a correction any more, sentiment through the roof:) Investor's Intelligence bull ratio never dipped below 55% for over two years. Its currently back at 73%, the AAII bull/bear ratio is at whopping 73%. That is exactly what I want to see around tops.... if you ask me we have a green light for the correction.
This is the logic and the analysis above and now listen carefully - if the SP500 moves bellow 1740 you have a road map, BUT until than do like the bulls - party, sing "Kumbaya My Lord" and shout up-up-up to the Moooooon... have a great weekend:)
TECHNICAL PICTURE
Short term - I expect some kind of a top after FOMC. MA50 could be tested first for a flat correction, or just grinding higher... I do not know.

Intermediate term - The two scenarios which I see - FOMC is intermediate term top(green) and than a correction after a rally for almost a year begins, or FOMC is short term top(red) and there will be one more push before a correction.

- Momentum Histogram/RSI - momentum is up, short term trend is up.
Long term - The pattern is still intact, MACD is struggling not to break its trend line... the bulls should master strong rally to negate all divergences and the historical pattern.
We have a rally which lasts almost a year without a correction and I still think that this leads to excessive greed and the consequence is always a sharp correction to purge the greed from the system. This shows us the pattern and I do not think that this time is different. It is always the same and only the excuses are different.

- Momentum Histogram/RSI - momentum has turned up, the intermediate term trend is up.
MARKET BREADTH INDICATORS
The Market Breadth Indicators - the same story, they look better buy signals, but the divergences are still there.
McClellan Oscillator - diverge at overbought levels...
McClellan Summation Index - buy signal, but still lower high
Weekly Stochastic of the Summation Index - still a sell signal.
Bullish Percentage - buy signal, but lower high and triple divergence.
Percent of Stocks above MA50 - overbought levels reached again. Short term and longer term divergence building at the moment.
Fear Indicator VXO - building a bottom... a looot of complacency again.
Advance-Decline Issues - overbought levels reached, expect lower high with divergence.
HURST CYCLES
The scenario that we already saw 20 week cycle low and we are currently in week 3 of the last one for this 18 month cycle has much higher probability after we did not see reversal last week.
Take step back and look at the big picture.... what we have till now? - three 18 month cycles. The first peaked at week 59 and we saw 10 weeks correction. This is late in the cycle, which is not surprise after severe bear market and 9 year low. The second one peaked at week 43 but the real correction started at week 53 and lasted 12 weeks. The third one peaked at week 51 and the correction lasted 9 weeks. To summarize - the last 20 week cycle peaked at week 59/53/51 and correction for 10/12/9 weeks has followed. I do not see a reason why this time should be different. We are currently at week 3 of the last 20 week cycle or in week 49 of the 18 month cycle. If the history repeats we should see a top in the next 1-2-3 weeks and roughly 10 weeks correction.
The daily chart did a great job again. At the moment we are at day 13. If I am right this 40 day cycle should top soon and a move lower into the second half of November should start.

I expect to see in the next several weeks the top of the last 20 week cycle the 40 week and 18 month cycle.
Look at the chat closely and make your own decision.... I think it is always the same and the history repeats.

Tom Demark SEQUENTIAL AND COUNTDOWN - this technique spots areas of exhaustion.
It looks like that the daily and weekly charts are peaking together. This is the strongest signal which you want to see at important top or bottom.
On the daily chart all counts has been finished this week. On the weekly chart 8 of the setup is almost sure and for 9 of the setup is not even necessary to make a new high.


Oct 24, 2013
Signals
Short term signal: DOWN - it will turn up above 1755
Intermediate term signal: UP - it will turn down bellow 1730
Comment: Not very convincing the bears, but as long as the price does not move above 1760 the risk stays to the downside.
Watch price behavior for clues:
- bearish scenario - toping in the next days and move bellow 1710
- move higher - pullback should stay above 1710
Levels to watch SP500:
- 1750 - resistance
- 1710 - minor support
- 1627 - support level
- 1597 - major support level
Oct 23, 2013
Signals
Short term signal: DOWN - it will turn up above 1753
Intermediate term signal: UP - it will turn down bellow 1730
Comment: Short term top was confirmed today. Lets see if it is something more than that.
Watch price behavior for clues:
- bearish scenario - toping in the next days and move bellow 1710
- move higher - pullback should stay above 1710
Levels to watch SP500:
- 1750 - resistance
- 1710 - minor support
- 1627 - support level
- 1597 - major support level
Oct 22, 2013
Signals
Short term signal: DOWN - it will turn up above 1755
Intermediate term signal: UP - it will turn down bellow 1712
Comment: This should be at least a short term top - intra day reversal and bearish candle, A/D issues and Put/Call ratio hitting extremes. NFP is like FOMC very often it marks top or bottom. If I knew that it is today, I would wrote in the weekend review to expect short term top today.
Watch price behavior for clues:
- bearish scenario - toping in the next days and move bellow 1695
- move higher - pullback should stay above 1695
Levels to watch SP500:
- 1750 - resistance
- 1710 - minor support
- 1627 - support level
- 1597 - major support level
Oct 20, 2013
Signals
Short term signal: UP - it will turn down bellow 1732
Intermediate term signal: UP - it will turn down bellow 1712
Comment: We stay bullish until we see something else.
Watch price behavior for clues:
- bearish scenario - toping in the next days and move bellow 1695
- move higher - pullback should stay above 1695
Levels to watch SP500:
- 1750 - resistance
- 1710 - minor support
- 1627 - support level
Weekly review
Short term view - pullback and than we will see what happens.
Intermediate term view - intermediate term trend is up, but I will be cautious with all this divergences.
Short living pullback and move higher as expected, so no surprises this week. After the "resolution" of the debt ceiling problem SP500 continued higher and touched the upper trend line of the wedge as I forecasted, but DJIA and DAX stalled the last two days printing bearish candles dragonfly doji and hanging man. That does not look very bullish to me...
For the next week I expected pullback and than we will see what happens. For the bearish scenario the indexes should start toping, for the bullish scenario 1-2 days pullback and another move higher.
Again I am leaning more to the bearish scenario because of cycles, divergences MACD daily and weekly, market breath indicators, history(see the weekly chart), but I am not calling top because it is the wrong way to trade in the long run. We know how a bearish or bullish move should look like and we will just follow the market. The discussions between bulls and bears in Internet are getting very hot:), the signals are bullish but be cautious a lot of red flags. Stay cool and just follow the market
TECHNICAL PICTURE
Short term - how the both scenarios should look like... the red scenario can make higher high, important is the move to be weak that is why this angle. Logical target for the pullback is support and MA50 around 1710.
 - Triple cross(EMA10 and EMA20 crossing EMA50) - triple cross is positive, short term trend is up.
Intermediate term - pullback max 2-3 days for the trend to take a breath, before moving higher and negate the triple MACD divergence, or the bears will take control....
 - Trend direction EMA50/MACD - the intermediate term trend is up, but be very cautious watch the MACD triple divergence.
- Momentum Histogram/RSI - momentum is up, short term trend is up.
Long term - The pattern is still intact, MACD is struggling not to break its trend line... the bulls should master strong rally to negate all divergences and the historical pattern.
 - Trend direction EMA50/MACD - long term trend is up - the price above MA50 and MACD above zero.
- Momentum Histogram/RSI - momentum has turned up, the intermediate term trend is up.
MARKET BREADTH INDICATORS
The Market Breadth Indicators - look better now switching to buy signal, but the divergences are still there....
McClellan Oscillator - near to overbought levels and outside the BB... pullback expected.
McClellan Summation Index - buy signal, but still lower high
Weekly Stochastic of the Summation Index - still on sell
Bullish Percentage - buy signal, but lower high.
Percent of Stocks above MA50 - overbought....
Fear Indicator VXO - plunged lower... a looot of complacency again.
Advance-Decline Issues - I think we will see another lower high.
HURST CYCLES
Again both scenarios bullish we saw 20 week cycle low and bearish this was only 20 day cycle low and we should see another move lower.
The bullish scenario - the indexes should continue moving higher in the next 2-3 weeks at least.

The bearish scenario - the indexes should top next week and start moving sharply lower.

Tom Demark SEQUENTIAL AND COUNTDOWN - this technique spots areas of exhaustion.
Setup, combo and countdown very close to be completed.... This means to expect a short term top next week.
 Setup at 6, the next two weeks will be compared with the two red candles and there is high probability to see at least 8 of the setup before a price flip even if SP500 does not make higher high.

Intermediate term view - intermediate term trend is up, but I will be cautious with all this divergences.
Short living pullback and move higher as expected, so no surprises this week. After the "resolution" of the debt ceiling problem SP500 continued higher and touched the upper trend line of the wedge as I forecasted, but DJIA and DAX stalled the last two days printing bearish candles dragonfly doji and hanging man. That does not look very bullish to me...
For the next week I expected pullback and than we will see what happens. For the bearish scenario the indexes should start toping, for the bullish scenario 1-2 days pullback and another move higher.
Again I am leaning more to the bearish scenario because of cycles, divergences MACD daily and weekly, market breath indicators, history(see the weekly chart), but I am not calling top because it is the wrong way to trade in the long run. We know how a bearish or bullish move should look like and we will just follow the market. The discussions between bulls and bears in Internet are getting very hot:), the signals are bullish but be cautious a lot of red flags. Stay cool and just follow the market
TECHNICAL PICTURE
Short term - how the both scenarios should look like... the red scenario can make higher high, important is the move to be weak that is why this angle. Logical target for the pullback is support and MA50 around 1710.

Intermediate term - pullback max 2-3 days for the trend to take a breath, before moving higher and negate the triple MACD divergence, or the bears will take control....

- Momentum Histogram/RSI - momentum is up, short term trend is up.
Long term - The pattern is still intact, MACD is struggling not to break its trend line... the bulls should master strong rally to negate all divergences and the historical pattern.

- Momentum Histogram/RSI - momentum has turned up, the intermediate term trend is up.
MARKET BREADTH INDICATORS
The Market Breadth Indicators - look better now switching to buy signal, but the divergences are still there....
McClellan Oscillator - near to overbought levels and outside the BB... pullback expected.
McClellan Summation Index - buy signal, but still lower high
Weekly Stochastic of the Summation Index - still on sell
Bullish Percentage - buy signal, but lower high.
Percent of Stocks above MA50 - overbought....
Fear Indicator VXO - plunged lower... a looot of complacency again.
Advance-Decline Issues - I think we will see another lower high.
HURST CYCLES
Again both scenarios bullish we saw 20 week cycle low and bearish this was only 20 day cycle low and we should see another move lower.
The bullish scenario - the indexes should continue moving higher in the next 2-3 weeks at least.

The bearish scenario - the indexes should top next week and start moving sharply lower.

Tom Demark SEQUENTIAL AND COUNTDOWN - this technique spots areas of exhaustion.
Setup, combo and countdown very close to be completed.... This means to expect a short term top next week.


Oct 17, 2013
Signals
Short term signal: UP - it will turn down bellow 1714
Intermediate term signal: UP - it will turn down bellow 1696
Comment: Nothing new, we stay bullish. SP500 almost reached the upper wedge line. For the bearish scenario the index should start topping and reverse in the next 2-3 days.
P.S SP500 is making new highs, but DJIA and DAX are a few points in the red... they have printed nice dragon fly candles. In the next day or two we will know if this is important.
Watch price behavior for clues:
- bearish scenario - toping in the next days and move bellow 1695.
- move higher - any pullback should stay above 1695.
Levels to watch SP500:
- 1740 - resistance
- 1710 - support
- 1670-1680 - support level
- 1627 - support level
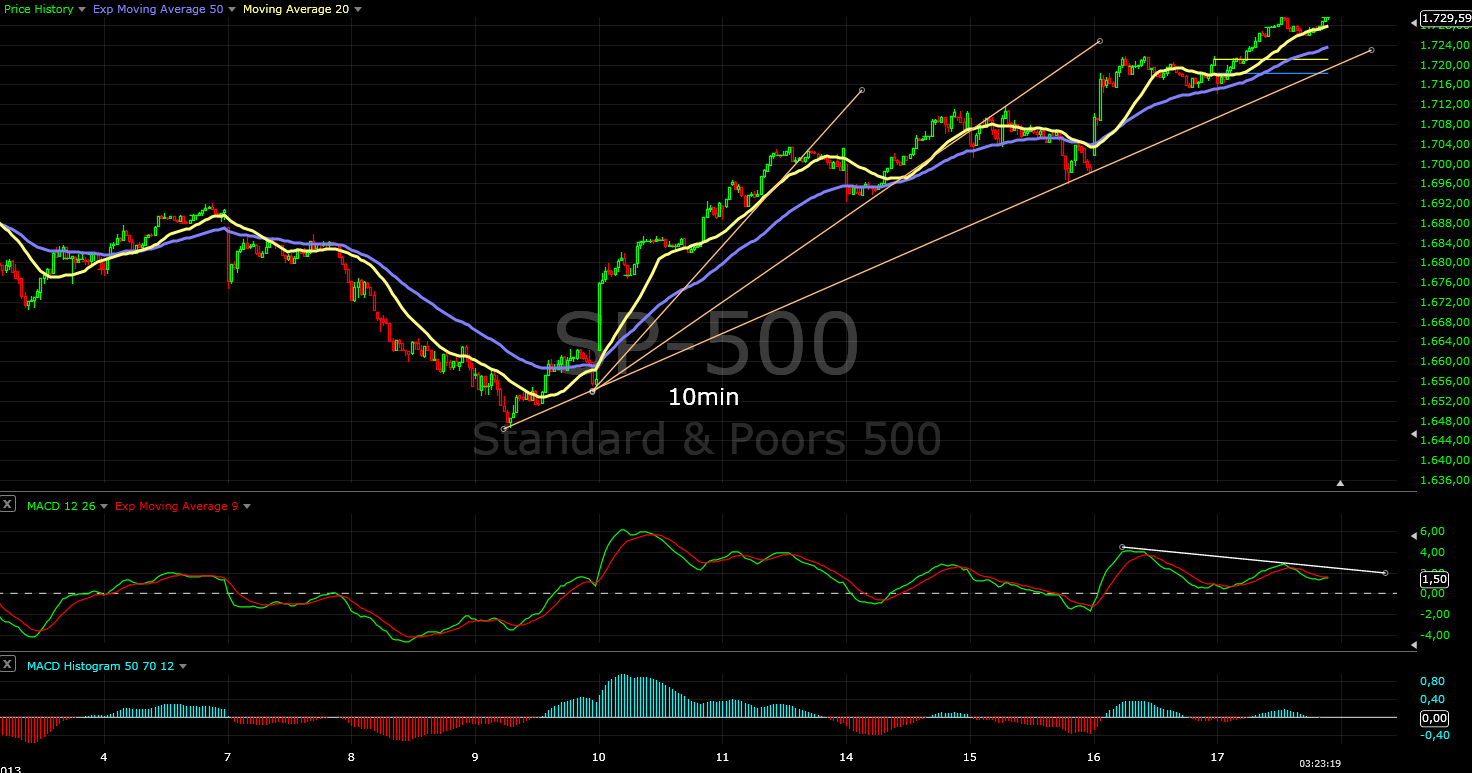
SP500 10 min chart with trend line fan... showing the chart just like that I find it interesting:) according to the rule when the third trend line is broken the move has reversed.... we are not there yet.

Oct 16, 2013
Signals
Short term signal: UP - it will turn down bellow 1696
Intermediate term signal: UP - it will turn down bellow 1696
Comment: Today we see the push after the problem has been "solved":). Now we will watch what happens in the next 2-3 days. For now we stay bullish.
Watch price behavior for clues:
- another leg lower - move lower breaking bellow 1680-1685
- move higher - pullback should stay above 1685
Levels to watch SP500:
- 1740 - resistance
- 1710 - resistance
- 1670-1680 - support level
- 1627 - support level
Oct 15, 2013
Signals
Short term signal: UP - it will turn down bellow 1696
Intermediate term signal: UP - it will turn down bellow 1688
Comment: Pullback to resistance 1710 as expected... I expect final pop after the problem is "solved".
Watch price behavior for clues:
- another leg lower - move lower breaking bellow 1680-1685
- move higher - pullback should stay above 1685
Levels to watch SP500:
- 1740 - resistance
- 1710 - resistance
- 1670-1680 - support level
- 1627 - support level
Oct 14, 2013
Signals
Short term signal: UP - it will turn down bellow 1691
Intermediate term signal: UP - it will turn down bellow 1688
Comment: Gap down, but the indexes did not correct really... another advance to resistance 1710 has followed. I think the pullback should start now. There is divergences on the smaller time frames.
Watch price behavior for clues:
- another leg lower - move breaking bellow 1680-1685
- move higher - pullback should stay above 1685
Levels to watch SP500:
- 1740 - resistance
- 1710 - resistance
- 1670-1680 - support level
- 1627 - support level
Oct 12, 2013
Weekly review
Short term view - more upside expected after short living pullback.
Intermediate term view - intermediate term will be more clear in week or two.
As I wrote the traders was not scared enough to see a bottom, but three day push lower has done the job. FOMC nailed the reversal... again, why do we use other indicators when FOMC is always the reversal point:) The week did not give us the answer which scenario will play out... will just follow the market and with the strong move from the bottom SP500 will probably make ATH for DJ it is not sure.
The two scenarios which I see are - more bullish one we saw 20 week cycle low and another 3-5 weeks higher probably to 1800 before significant correction, more bearish this was just 20 day cycle low and this move will not last very long before it reverses. How to make the difference - there is more upside in the next days but the bearish scenario should top around 17 or short after that. If this move keeps moving higher the week after next the bullish scenario has higher probability. See the daily and cycle charts how the two scenarios should look like.
I am leaning more to the bearish scenario because I think important events(the debt ceiling) does not happen in the middle of a move rather they are top or bottom, the big boys use them to buy cheap/sell high and after months of a topping process am skeptical of the indexes blasting higher for a month or two.
Of course I can not prove or guarantee this so we should stay bullish but cautious until we see evidence for something bearish.
TECHNICAL PICTURE
Short term - more upside probably after short living pullback... I do not see a reversal in the next 2-3 days.
 - Triple cross(EMA10 and EMA20 crossing EMA50) - triple cross up the short term trend is up.
Intermediate term - the lower wedge line was breached and we must exclude the candle's shadows to redraw it again, but I think it was fake break out. Green the bullish scenario and red the bearish one. The MACD divergence does not look good. Even if the bullish scenario plays out I think we will see another MACD lower high and significant correction will follow.
 - Trend direction EMA50/MACD - the intermediate term trend is technically up, but be very cautious watch the MACD double divergence.
- Momentum Histogram/RSI - momentum has turned up short term trend is up.
Long term - MACD is struggling not to break its trend line... the bulls should master strong rally to negate all divergences.
 - Trend direction EMA50/MACD - ong term trend is up - the price above MA50 and MACD above zero.
- Momentum Histogram/RSI - momentum is trying to turn up...
MARKET BREADTH INDICATORS
The Market Breadth Indicators - are not very helpful at the moment. The big picture says the same - multiple divergences the indexes are topping.
McClellan Oscillator - moving up after oversold levels.
McClellan Summation Index - sell signal with double divergence.
Weekly Stochastic of the Summation Index - sell signal.
Bullish Percentage - sell signal with double divergence.
Percent of Stocks above MA50 - another lower high?
Fear Indicator VXO - another higher low and double divergence?
Issues Advancing - nothing interesting.
HURST CYCLES
Here are the two alternate scenarios. We can not say which one is the right one, or I do not know, I am not an expert:)
The first chart the bullish one - we saw 20 week cycle low and move higher for several weeks should follow.
What bothers me with this scenario - you have the first two 20 week cycles moving higher, the third one moving sideways making the transition from up to down for the 18 month cycle and than the last 20 week cycle moving up again!!??!! It does not make sense at all... move now to the weekly chart it continues there:)

On this chart the 20 week cycle does not look finished. You can say we have very short 40 day cycle or we have 20 day cycle several days longer than the average one. If I go back through the chart I see both cases occur equally often..... and I can not say which one is more probable.
Now look back the previous three 18 month cycles - even with the very strong bull market, which we have since 2009, the last 20 week cycle was always down twice really very hard 15%-20% down and ones milder but 9 of 11 weeks down. Why the difference? - the first two 18 month cycles have started very strong, moving higher and higher with no correction, that leads to too much greed and such moves finish with sharp correction, which is very common in a bull market. The third one was interrupted twice from corrections and was moving more sideways - no excessive greed. Compare with the current one which case do we have? Why should this time be different?

Tom Demark SEQUENTIAL AND COUNTDOWN - this technique spots areas of exhaustion.
Nothing interesting on the daily chart price flips on both directions. The weekly chart is interesting the setup is still in tact at 5 now. If the bullish scenario plays out it will be finished and we should follow it closely.

Intermediate term view - intermediate term will be more clear in week or two.
As I wrote the traders was not scared enough to see a bottom, but three day push lower has done the job. FOMC nailed the reversal... again, why do we use other indicators when FOMC is always the reversal point:) The week did not give us the answer which scenario will play out... will just follow the market and with the strong move from the bottom SP500 will probably make ATH for DJ it is not sure.
The two scenarios which I see are - more bullish one we saw 20 week cycle low and another 3-5 weeks higher probably to 1800 before significant correction, more bearish this was just 20 day cycle low and this move will not last very long before it reverses. How to make the difference - there is more upside in the next days but the bearish scenario should top around 17 or short after that. If this move keeps moving higher the week after next the bullish scenario has higher probability. See the daily and cycle charts how the two scenarios should look like.
I am leaning more to the bearish scenario because I think important events(the debt ceiling) does not happen in the middle of a move rather they are top or bottom, the big boys use them to buy cheap/sell high and after months of a topping process am skeptical of the indexes blasting higher for a month or two.
Of course I can not prove or guarantee this so we should stay bullish but cautious until we see evidence for something bearish.
TECHNICAL PICTURE
Short term - more upside probably after short living pullback... I do not see a reversal in the next 2-3 days.

Intermediate term - the lower wedge line was breached and we must exclude the candle's shadows to redraw it again, but I think it was fake break out. Green the bullish scenario and red the bearish one. The MACD divergence does not look good. Even if the bullish scenario plays out I think we will see another MACD lower high and significant correction will follow.

- Momentum Histogram/RSI - momentum has turned up short term trend is up.
Long term - MACD is struggling not to break its trend line... the bulls should master strong rally to negate all divergences.

- Momentum Histogram/RSI - momentum is trying to turn up...
MARKET BREADTH INDICATORS
The Market Breadth Indicators - are not very helpful at the moment. The big picture says the same - multiple divergences the indexes are topping.
McClellan Oscillator - moving up after oversold levels.
McClellan Summation Index - sell signal with double divergence.
Weekly Stochastic of the Summation Index - sell signal.
Bullish Percentage - sell signal with double divergence.
Percent of Stocks above MA50 - another lower high?
Fear Indicator VXO - another higher low and double divergence?
Issues Advancing - nothing interesting.
HURST CYCLES
Here are the two alternate scenarios. We can not say which one is the right one, or I do not know, I am not an expert:)
The first chart the bullish one - we saw 20 week cycle low and move higher for several weeks should follow.
What bothers me with this scenario - you have the first two 20 week cycles moving higher, the third one moving sideways making the transition from up to down for the 18 month cycle and than the last 20 week cycle moving up again!!??!! It does not make sense at all... move now to the weekly chart it continues there:)

On this chart the 20 week cycle does not look finished. You can say we have very short 40 day cycle or we have 20 day cycle several days longer than the average one. If I go back through the chart I see both cases occur equally often..... and I can not say which one is more probable.

Now look back the previous three 18 month cycles - even with the very strong bull market, which we have since 2009, the last 20 week cycle was always down twice really very hard 15%-20% down and ones milder but 9 of 11 weeks down. Why the difference? - the first two 18 month cycles have started very strong, moving higher and higher with no correction, that leads to too much greed and such moves finish with sharp correction, which is very common in a bull market. The third one was interrupted twice from corrections and was moving more sideways - no excessive greed. Compare with the current one which case do we have? Why should this time be different?

Tom Demark SEQUENTIAL AND COUNTDOWN - this technique spots areas of exhaustion.
Nothing interesting on the daily chart price flips on both directions. The weekly chart is interesting the setup is still in tact at 5 now. If the bullish scenario plays out it will be finished and we should follow it closely.

Oct 10, 2013
Signals
Short term signal: UP - it will turn down bellow 1675
Intermediate term signal: UP - it will turn down bellow 1662
Comment: The strength today and five waves impulse means that this should be a move of a bigger degree. So no lower low with divergence
and perfect move. It think yesterday was 20 week cycle low ant the next 20 week cycle which is the last one in the 18 month cycle has begun.
Short term - 5 fives expect more upside
Long term - If all the indicators, divergences, cycles etc. work:) this move should not last more than several weeks and top early in the cycle.
Bottom now is bad for the bulls if you ask me. Why? Because it looks like buy the rumor sell the news... When the big boys want to move the price higher they want to buy cheap push the prise lower, negative sentiment, debt ceiling problem and buy cheap when all are depressed and start a rally.
When the big boys want to sell they will push the prise higher to sell higher, buy the rumor everything will be ok and push the price higher, the problem is solved, sell the news at higher prise and leave the bag holders cry.
To cut a long story short - I expect move up until 17.October, an exhaustion bar after the debt ceiling problem is solved and a top not long after that.
Watch price behavior for clues:
- another leg lower - the move should find resistance around 1710
- fake break out and this is the bottom - reversal candle and strong rally moving above 1680 <- that is what we see now.
Levels to watch SP500:
- 1710 - resistance
- 1670-1680 - resistance level
- 1627 - support level
- 1598 - is major support.
Oct 9, 2013
Signals
Short term signal: UP - activated today with divergence on the smaller time frames,it will turn down bellow 1651
Intermediate term signal: DOWN - it will turn up above 1680
Comment:The indexes are trying to bounce from oversold levels as expected. The perfect scenario will be a bounce for a few days followed by a lower low with divergence which will be a 20 week cycle low... than you know debt ceiling, problem solved, breathe again the world is saved:) and a rally for several weeks
Watch price behavior for clues:
- another leg lower - sell off breaking bellow 1670 <- that is what we see for now.
- fake break out and this is the bottom - reversal candle and strong rally moving above 1680 (MA50 and yesterday's candle high).
Levels to watch SP500:
- 1710 - resistance
- 1670-1680 - resistance level
- 1627 - support level
- 1598 - is major support.
Oct 8, 2013
Signals
Short term signal: DOWN - it will turn up above 1665
Intermediate term signal: DOWN - it will turn up above 1680
Comment: The bearish scenario, which I showed in the weekly review, is playing out. As I wrote 1680(MA50) was the line in the sand
and the close yesterday bellow this level confirmed that more on the downside is to be expected. The strong move killed the most short
term scenarios and I think we have now clear down move.
Tomorrow is FOMC which usually marks bottom/top VIX and NYMO outside their BB for second day, so probably we will see a bounce
for 2-3 days.
Watch price behavior for clues:
- another leg lower - sell off breaking bellow 1670 <- that is what we see for now.
- fake break out and this is the bottom - reversal candle and strong rally moving above 1680 (MA50 and todays candle's high).
Levels to watch SP500:
- 1710 - resistance
- 1670-1680 - resistance level
- 1627 - support level
- 1598 - is major support.
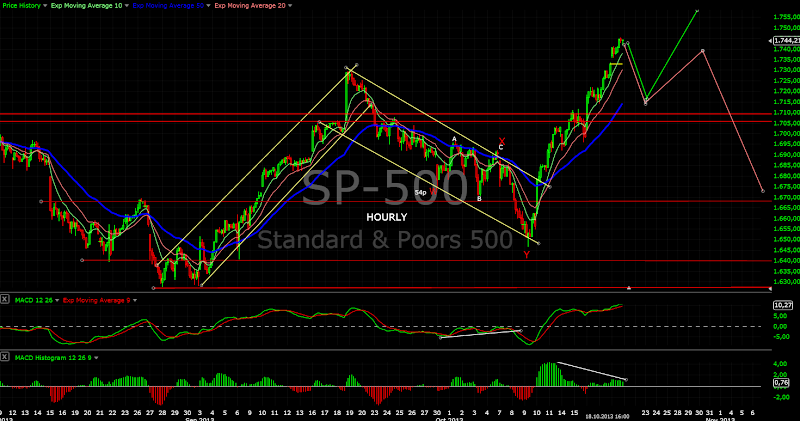
Here is the updated hourly chart... I am not an EW guy but if this count is right the move lower should touch at least ~1640 where Y=W


Oct 7, 2013
Signals
Short term signal: DOWN - it will turn up above 1686
Intermediate term signal: DOWN - it will turn up above 1692
Comment: More choppy action, more confusion... but today does not look good for the bulls - close bellow MA50(1680). If you ask me the bulls will be scared a little bit more(one more leg lower) and than... thank god we are saved the debt ceiling problem is resolved everything is rosy again(intermediate term bottom).
A lot of possible scenarios for the short term. I wanted to show a chart, but too many options.... The market is definitely news driven and the short term pattern can take different shapes
Watch price behavior for clues:
- another leg lower - not more than a bounce lower than 1710 and sell off breaking bellow 1670.
- a rally higher should start soon - the support area 1670-1680 holds and move higher above 1710.
Levels to watch SP500:
- 1710 - resistance
- 1670-1680 - support level
- 1627 - support level
- 1598 - is major support.
Oct 5, 2013
Weekly review
Short term view - not sure which scenario will play out.
Intermediate term view - not sure which scenario will play out.
The indexes are trying to bottom, at least for the short term. No surprise, the question now is - which scenario will play out?
I really do not know and the indicators does not give us an edge. Yes, they are signaling for a trouble ahead intermediate term and maybe long term, but there is no problem to see a new ATH before a reversal.
What to do? We will follow the market and wait for more information.
The bullish case(green on the charts) - SP500 reached support level, 61,8% retracement, the lower wedge trend line, MA50, MACD the zero line. We have deceleration(reg-green-red-green candles), the histogram turned up, bullish candle formation, the cycles are mature and probably a double bottom on the hourly chart. As long as the price stays above 1680 we should be bullish and expect a move toward the upper wedge trend line.
The bearish case(red on the charts) - we have a topping pattern for several months, supported by a lot of divergences on different indicators, bullish sentiment, everybody expecting the next ATH trained like the Pavlov's dog and than happens this one more leg lower - just a bounce and another leg lower. I do not see problem this scenario to play out - no flush to the downside to scare the traders and second the market does not make does what the most are expecting from it. Just watch the 1680 level.(I have posted the chart for two weeks "You are here" was up-to-date now we are at MA50.)
TECHNICAL PICTURE
Short term - 1680 is the line in the sand, as long as the price stays above it we should be bullish. If broken another leg lower to ~1640 W=Y.
 - Triple cross(EMA10 and EMA20 crossing EMA50) - there is no triple cross yet and the short term trend is technically down.
Intermediate term - I have explained about the two scenarios, you can see them visually.
 - Trend direction EMA50/MACD - the price found support at MA50 and MACD trying to turn up at the zero line. Watch out for the MACD double divergence. Intermediate term trend is technically up.
- Momentum Histogram/RSI - momentum is trying to turn up, the short term trend is technically still down.
Long term - DJ is very weak compared with the other indexes. I do not see anything bullish if you ask me. Three tops, shooting star followed by two red weeks, the histogram turned lower, MACD is ready to break it's trend line since 2009, the pattern which I am showing for months is working.... if I look at the DJ, I am more bearish than bullish.
 - Trend direction EMA50/MACD - long term trend is up - the price above MA50 and MACD above zero.
- Momentum Histogram/RSI - not clear.... no useful information.
MARKET BREADTH INDICATORS
The Market Breadth Indicators - no change weak but still bullish, oscillators are reseting and double and triple divergences everywhere.
McClellan Oscillator - overshooted the lower BB and a bounce is expected.
McClellan Summation Index - buy signal, but weak and way bellow previous tops... making a double divergence.
Weekly Stochastic of the Summation Index - buy signal... reached the overbought area. No much left to the upside and a lot of room for a move lower???
Bullish Percentage - buy signal, but no "enthusiasm" at all... double divergence.
Percent of Stocks above MA50 - in the middle of the range... every rally is followed by a lower high of the indicator - not good.
Fear Indicator VXO - made a higher low and pushed above the upper BB. Needs to cool off.
Issues Advancing - in the middle of the range.. still have hit a bottom on the indexes??
HURST CYCLES
We do not have an edge at the moment looking at the cycles(or I do not see it:). The short term 40 day cycle and the longer term 20 week cycle are mature enough and its possible that we saw a bottom on Friday. On the other side it will not be a problem to see another sell off for a 2 weeks.

The cycle is mature at week 15.

Tom Demark SEQUENTIAL AND COUNTDOWN - this technique spots areas of exhaustion.
The green candle in the middle invalidated the buy setup only for one point and on Friday we saw a price flip. I think we can accept it for finished and short term bottom was hit on Friday. Now we should see at least a bounce higher.
 Still no price flip to confirm a trend change or least an intermediate term top.

Intermediate term view - not sure which scenario will play out.
The indexes are trying to bottom, at least for the short term. No surprise, the question now is - which scenario will play out?
I really do not know and the indicators does not give us an edge. Yes, they are signaling for a trouble ahead intermediate term and maybe long term, but there is no problem to see a new ATH before a reversal.
What to do? We will follow the market and wait for more information.
The bullish case(green on the charts) - SP500 reached support level, 61,8% retracement, the lower wedge trend line, MA50, MACD the zero line. We have deceleration(reg-green-red-green candles), the histogram turned up, bullish candle formation, the cycles are mature and probably a double bottom on the hourly chart. As long as the price stays above 1680 we should be bullish and expect a move toward the upper wedge trend line.
The bearish case(red on the charts) - we have a topping pattern for several months, supported by a lot of divergences on different indicators, bullish sentiment, everybody expecting the next ATH trained like the Pavlov's dog and than happens this one more leg lower - just a bounce and another leg lower. I do not see problem this scenario to play out - no flush to the downside to scare the traders and second the market does not make does what the most are expecting from it. Just watch the 1680 level.(I have posted the chart for two weeks "You are here" was up-to-date now we are at MA50.)
TECHNICAL PICTURE
Short term - 1680 is the line in the sand, as long as the price stays above it we should be bullish. If broken another leg lower to ~1640 W=Y.

Intermediate term - I have explained about the two scenarios, you can see them visually.

- Momentum Histogram/RSI - momentum is trying to turn up, the short term trend is technically still down.
Long term - DJ is very weak compared with the other indexes. I do not see anything bullish if you ask me. Three tops, shooting star followed by two red weeks, the histogram turned lower, MACD is ready to break it's trend line since 2009, the pattern which I am showing for months is working.... if I look at the DJ, I am more bearish than bullish.

- Momentum Histogram/RSI - not clear.... no useful information.
MARKET BREADTH INDICATORS
The Market Breadth Indicators - no change weak but still bullish, oscillators are reseting and double and triple divergences everywhere.
McClellan Oscillator - overshooted the lower BB and a bounce is expected.
McClellan Summation Index - buy signal, but weak and way bellow previous tops... making a double divergence.
Weekly Stochastic of the Summation Index - buy signal... reached the overbought area. No much left to the upside and a lot of room for a move lower???
Bullish Percentage - buy signal, but no "enthusiasm" at all... double divergence.
Percent of Stocks above MA50 - in the middle of the range... every rally is followed by a lower high of the indicator - not good.
Fear Indicator VXO - made a higher low and pushed above the upper BB. Needs to cool off.
Issues Advancing - in the middle of the range.. still have hit a bottom on the indexes??
HURST CYCLES
We do not have an edge at the moment looking at the cycles(or I do not see it:). The short term 40 day cycle and the longer term 20 week cycle are mature enough and its possible that we saw a bottom on Friday. On the other side it will not be a problem to see another sell off for a 2 weeks.

The cycle is mature at week 15.

Tom Demark SEQUENTIAL AND COUNTDOWN - this technique spots areas of exhaustion.
The green candle in the middle invalidated the buy setup only for one point and on Friday we saw a price flip. I think we can accept it for finished and short term bottom was hit on Friday. Now we should see at least a bounce higher.


Oct 3, 2013
Signals
Short term signal: DOWN - it will turn up above 1683
Intermediate term signal: DOWN - it will turn up above 1693
Comment: SP500 almost touched the lower trend line of the wedge, 61,8% retracement and reached support zone. The move is definitely corrective.
The cycles are nearing a bottom. BUT still no signs of a bottom. Stay short but tighten the stops...
Watch price behavior for clues:
- top is in and leg down has begun - sell off continues and we see technical damages - move bellow 1670.
- a rally higher underway - not more than a pullback to support 1675-1682 and another move higher.
Levels to watch SP500:
- 1710 - resistance
- 1670-1680 - support level
- 1627 - support level
- 1598 - is major support.
The channel has been expanded. Probably final push lower with divergence will mark the bottom for this move....


Oct 2, 2013
Signals
Short term signal: DOWN - it will turn up above 1693
Intermediate term signal: DOWN - it will turn up above 1696
Comment: The patern looks like a triangle for now and the "short term bottom" could be just a sideway move. Nevertheless that confirms the idea, that is early to get bullish.
Watch price behavior for clues:
- top is in and leg down has begun - sell off continues and we see technical damages - move bellow 1670.
- a rally higher underway - not more than a pullback to support 1675-1682 and another move higher.
Levels to watch SP500:
- 1710 - resistance
- 1675-1682 - support level
- 1627 - support level
- 1598 - is major support.
Oct 1, 2013
Signals
Short term signal: UP - it will turn down bellow 1687
Intermediate term signal: DOWN - it will turn up above 1696
Comment: SP500 trying to bottom as expected... if the cycles are right again(acurate so far) any move higher should not last very long several days
before final low in 2-3 weeks.
Watch price behavior for clues:
- top is in and leg down has begun - sell off continues and we see technical damages - move bellow 1670.
- a rally higher underway - not more than a pullback to support 1675-1682 and another move higher.
Levels to watch SP500:
- 1710 - resistance
- 1675-1682 - support level
- 1627 - support level
- 1598 - is major support.
Subscribe to:
Posts (Atom)