Feb 28, 2017
Update
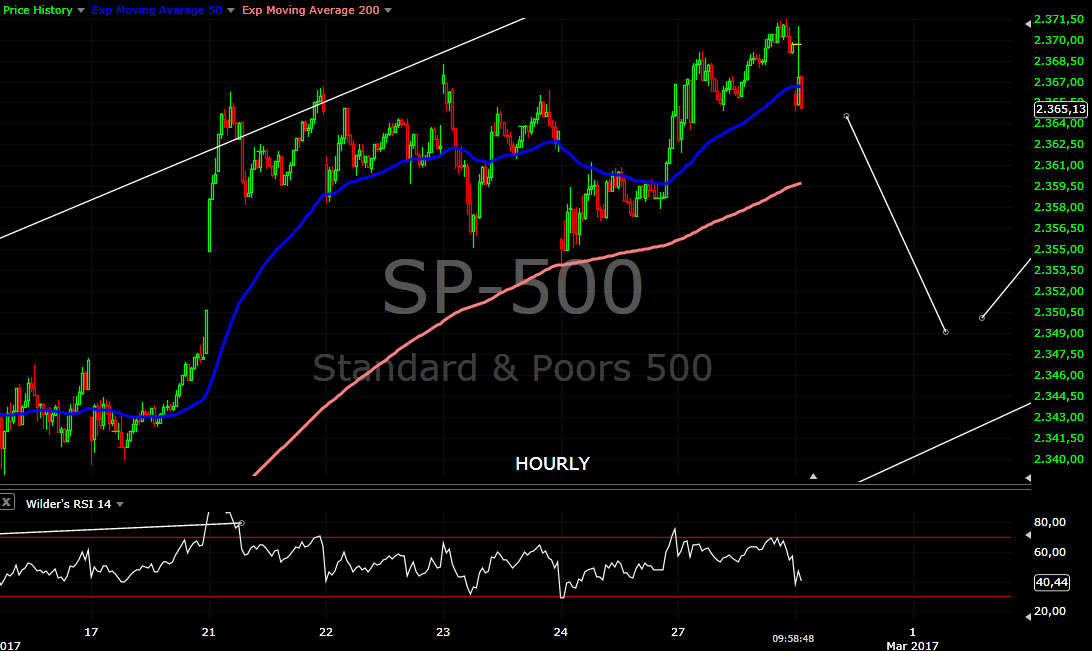
UPDATE - Yesterday I pointed out that we have impulse higher and this is not wave iv anymore. It looks like this impulse was just wave (i) of v and today we are seeing wave (iii) of v
Careful if you have longs. We have 5 waves higher so this could be the top. Now we have enough waves to count finished pattern from the January low.
This is 10 min chart it looks like impulse higher probably this is not part of wave iv.

Feb 25, 2017
Weekly preview
Short term view - waiting for the final waves iv and v higher and the move to be finished.
Intermediate term view - when it is finished the high should be an intermediate term top followed by a correction for 2 months. We have the small pop higher to finish wave iii now wave iv is running. Nothing new, the analysis stays the same. Waiting for the current move higher to be finished and the top should be an 18 month cycle high followed by a correction for 6-8 weeks. On the daily chart I have changed the red count. To be honest now with the strong leg higher the move since Feb.2016 counts better as two zig-zags compared to bullish 1-2 1-2... I will just wait and see what happens in March and April. TECHNICAL PICTURE and ELLIOTT WAVES
Short term - wave iv should be shallow sideward move 20-25 points. If we saw the top for wave iii the measurements for wave v are roughly 45 and 70 points.

Intermediate term - changed the diagonal count(red), SP500 moved too high. It still counts very well as two a-b-c waves higher, but you need to change the place of w1 and w2(red). There is two support areas - in the bullish case w4(green) should move to the area of the previous wave iv, in the bearish case w4(red) should overlap with w1(red).

Long term - no change, waiting for the wave from Feb.2016 to be finished.

MARKET BREADTH INDICATORS
The Market Breadth Indicators - many indicators did not move higher despite the strong move, they ignored it - a red flag. The big picture is bearish with divergences, now waiting for the indicators to turn lower and sell signal.
McClellan Oscillator - lower again, making lower highs.
McClellan Summation Index - buy signal.
Weekly Stochastic of the Summation Index - buy signal.
Bullish Percentage - buy signal.
Percent of Stocks above MA50 - around the overbought level, again lower high.
Fear Indicator VIX - more and more tight BB, the question is not if, but when it will explode higher.
Advance-Decline Issues - it just refuses to move higher despite the strong leg up.
HURST CYCLES
Day 17 of the 40 day cycle. Expect mid-cycle low(the small numbers on the chart) on day 18-19 with the low for wave iv.
Week 5 of the last 20 week cycle..... waiting for the 18 month cycle high.
Some readers are bearish and other just irritated by the never ending bull market.... so here is what I think. Such strong final phase is typical for the end of a bull market. If I compare the previous tops 2000/2007 with now and look at EW counts/cycles/market breadth they suggest the same scenario. I expect the same topping pattern with three tops before significant sell off - top with strength(now), one more higher high with weakness, test of the high(lower high). I think it is too early to be very bearish and make big bets on the short side. There is no point waiting 6 months or longer for the big short. Currently the indexes are where the green arrow is. We should see 6-8 weeks correction for the 18 month cycle low. Higher high for a finished pattern. First move lower to the MA20 followed by test of the high and then the sell off should begin. Do not expect a plunge before seeing the price below MA20 - see the red arrows. I think we are where the arrow is. Yes we have very very high complacency, but this is typical for a high before THE TOP. Expect one more higher high with divergences before thinking about the end of the bull market. First we should see the VIX break above the trend line to at least 21-22 followed by a higher low with divergence.

Intermediate term view - when it is finished the high should be an intermediate term top followed by a correction for 2 months. We have the small pop higher to finish wave iii now wave iv is running. Nothing new, the analysis stays the same. Waiting for the current move higher to be finished and the top should be an 18 month cycle high followed by a correction for 6-8 weeks. On the daily chart I have changed the red count. To be honest now with the strong leg higher the move since Feb.2016 counts better as two zig-zags compared to bullish 1-2 1-2... I will just wait and see what happens in March and April. TECHNICAL PICTURE and ELLIOTT WAVES
Short term - wave iv should be shallow sideward move 20-25 points. If we saw the top for wave iii the measurements for wave v are roughly 45 and 70 points.

Intermediate term - changed the diagonal count(red), SP500 moved too high. It still counts very well as two a-b-c waves higher, but you need to change the place of w1 and w2(red). There is two support areas - in the bullish case w4(green) should move to the area of the previous wave iv, in the bearish case w4(red) should overlap with w1(red).

Long term - no change, waiting for the wave from Feb.2016 to be finished.

MARKET BREADTH INDICATORS
The Market Breadth Indicators - many indicators did not move higher despite the strong move, they ignored it - a red flag. The big picture is bearish with divergences, now waiting for the indicators to turn lower and sell signal.
McClellan Oscillator - lower again, making lower highs.
McClellan Summation Index - buy signal.
Weekly Stochastic of the Summation Index - buy signal.
Bullish Percentage - buy signal.
Percent of Stocks above MA50 - around the overbought level, again lower high.
Fear Indicator VIX - more and more tight BB, the question is not if, but when it will explode higher.
Advance-Decline Issues - it just refuses to move higher despite the strong leg up.
HURST CYCLES
Day 17 of the 40 day cycle. Expect mid-cycle low(the small numbers on the chart) on day 18-19 with the low for wave iv.

Week 5 of the last 20 week cycle..... waiting for the 18 month cycle high.

Some readers are bearish and other just irritated by the never ending bull market.... so here is what I think. Such strong final phase is typical for the end of a bull market. If I compare the previous tops 2000/2007 with now and look at EW counts/cycles/market breadth they suggest the same scenario. I expect the same topping pattern with three tops before significant sell off - top with strength(now), one more higher high with weakness, test of the high(lower high). I think it is too early to be very bearish and make big bets on the short side. There is no point waiting 6 months or longer for the big short. Currently the indexes are where the green arrow is. We should see 6-8 weeks correction for the 18 month cycle low. Higher high for a finished pattern. First move lower to the MA20 followed by test of the high and then the sell off should begin. Do not expect a plunge before seeing the price below MA20 - see the red arrows.


Feb 18, 2017
Weekly preview
Short term view - waiting for the final waves iv and v higher and the move to be finished.
Intermediate term view - when it is finished the high should be an intermediate term top followed by a correction for 2 months.
Nothing new, the indexes moved higher as expected. The move develops as an impulse and now waiting for waves iv and v so that we have a finished pattern.
TECHNICAL PICTURE and ELLIOTT WAVES
Short term - small pop after the long weekend should finish wave iii then wave iv should begin. Target around 2325-2330 - 38,2% Fibo/the trend line/MA50. Support and invalidation level is now around 2300.
Intermediate term - the same like last week. Momentum(histogram) is up, RSI no such strong divergence, but only for SPX(other indexes are ok) and well visible MACD divergence.

Long term - no change, waiting for the wave from Feb.2016 to be finished.

MARKET BREADTH INDICATORS
The Market Breadth Indicators - many indicators did not move higher despite the strong move, they ignored it - a red flag. The big picture is bearish with divergences, now waiting for the indicators to turn lower and sell signal.
McClellan Oscillator - around zero despite the strong move higher.
McClellan Summation Index - buy signal.
Weekly Stochastic of the Summation Index - in overbought territory, no sell signal so far.
Bullish Percentage - buy signal.
Percent of Stocks above MA50 - another lower high, despite the strong move.
Fear Indicator VIX - even more tight BB, is not moving lower despite the strongest part of this wave higher.
Advance-Decline Issues - turned lower despite the rally.
HURST CYCLES
Day 13 of the 40 day
Week 4 of the last 20 week cycle..... waiting for the 18 month cycle high.
Tom Demark SEQUENTIAL AND COUNTDOWN - this technique spots areas of exhaustion.
Now we have finished 9-13-9 on the daily and weekly chart. The first sell signal is if you see a price flip,but there is no such so far - momentum is up and above the MA.
Intermediate term view - when it is finished the high should be an intermediate term top followed by a correction for 2 months.
Nothing new, the indexes moved higher as expected. The move develops as an impulse and now waiting for waves iv and v so that we have a finished pattern.
TECHNICAL PICTURE and ELLIOTT WAVES
Short term - small pop after the long weekend should finish wave iii then wave iv should begin. Target around 2325-2330 - 38,2% Fibo/the trend line/MA50. Support and invalidation level is now around 2300.

Intermediate term - the same like last week. Momentum(histogram) is up, RSI no such strong divergence, but only for SPX(other indexes are ok) and well visible MACD divergence.

Long term - no change, waiting for the wave from Feb.2016 to be finished.

MARKET BREADTH INDICATORS
The Market Breadth Indicators - many indicators did not move higher despite the strong move, they ignored it - a red flag. The big picture is bearish with divergences, now waiting for the indicators to turn lower and sell signal.
McClellan Oscillator - around zero despite the strong move higher.
McClellan Summation Index - buy signal.
Weekly Stochastic of the Summation Index - in overbought territory, no sell signal so far.
Bullish Percentage - buy signal.
Percent of Stocks above MA50 - another lower high, despite the strong move.
Fear Indicator VIX - even more tight BB, is not moving lower despite the strongest part of this wave higher.
Advance-Decline Issues - turned lower despite the rally.
HURST CYCLES
Day 13 of the 40 day

Week 4 of the last 20 week cycle..... waiting for the 18 month cycle high.

Tom Demark SEQUENTIAL AND COUNTDOWN - this technique spots areas of exhaustion.
Now we have finished 9-13-9 on the daily and weekly chart. The first sell signal is if you see a price flip,but there is no such so far - momentum is up and above the MA.

Feb 11, 2017
Weekly preview
Short term view - more to the upside and waiting for the move higher to be finished.
Intermediate term view - when it is finished the high should be an intermediate term top followed by a correction for 2 months.
The indexes moved higher as expected, now waiting this final move higher to be finished. Currently I think we are in wave iii, the rally is not very strong so just waiting for 5 waves higher and to see if it will be an ED or simple impulse. When the current move higher is finished, we will have - finished EW pattern, MACD/RSI divergences on the daily chart, bearish market breadth with divergences, cycles in the time window for an 18 month cycle high, TomDemark finished 9-13-9 on the weekly chart. To me all signs are pointing to an intermediate term top around the corner. TECHNICAL PICTURE and ELLIOTT WAVES
Short term - changed the ED a little bit to be synchronized with the DJIA. If this is the right pattern the indexes should continue crawling higher for a few more days. If the price just continue higher on Monday/Tuesday it will be a simple impulse.
A move below the support area means with high probability a move lower has begun.

Intermediate term - it looks now like mature pattern with the final move higher running. We have MACD/RSI divergences, which is usually a signal to expect a bigger move in the opposite direction.

Long term - no change, waiting for the wave from Feb.2016 to be finished.

MARKET BREADTH INDICATORS
The Market Breadth Indicators - the big picture is bearish with divergences, waiting for the indicators to turn lower and sell signal.
McClellan Oscillator - positive, but series of lower highs.
McClellan Summation Index - still buy signal.
Weekly Stochastic of the Summation Index - turned up gain, but should not last for long.
Bullish Percentage - buy signal, I expect lower high
Percent of Stocks above MA50 - heading higher, I expect another lower high.
Fear Indicator VIX - a lot of complacency and very tight BB. Volatility will rise sharply soon.
Advance-Decline Issues - one final spike to the overbought area will look great.
HURST CYCLES
I have explained last week about longer and shorter cycles and that I suspect a stealth wave 4 and 20 week cycle low behind us. I have adjusted the counts for shorter cycles.
Day 8 of the 40 day
Week 3 of the last 20 week cycle..... waiting for the 18 month cycle high.
Tom Demark SEQUENTIAL AND COUNTDOWN - this technique spots areas of exhaustion.
Still no price flip(sell signal) on the weekly chart. Day 6 of a setup on the daily chart... it will be interesting if it will be finished, than we will have a finished 9-13-9 on the daily and weekly chart.
Intermediate term view - when it is finished the high should be an intermediate term top followed by a correction for 2 months.
The indexes moved higher as expected, now waiting this final move higher to be finished. Currently I think we are in wave iii, the rally is not very strong so just waiting for 5 waves higher and to see if it will be an ED or simple impulse. When the current move higher is finished, we will have - finished EW pattern, MACD/RSI divergences on the daily chart, bearish market breadth with divergences, cycles in the time window for an 18 month cycle high, TomDemark finished 9-13-9 on the weekly chart. To me all signs are pointing to an intermediate term top around the corner. TECHNICAL PICTURE and ELLIOTT WAVES
Short term - changed the ED a little bit to be synchronized with the DJIA. If this is the right pattern the indexes should continue crawling higher for a few more days. If the price just continue higher on Monday/Tuesday it will be a simple impulse.
A move below the support area means with high probability a move lower has begun.

Intermediate term - it looks now like mature pattern with the final move higher running. We have MACD/RSI divergences, which is usually a signal to expect a bigger move in the opposite direction.

Long term - no change, waiting for the wave from Feb.2016 to be finished.

MARKET BREADTH INDICATORS
The Market Breadth Indicators - the big picture is bearish with divergences, waiting for the indicators to turn lower and sell signal.
McClellan Oscillator - positive, but series of lower highs.
McClellan Summation Index - still buy signal.
Weekly Stochastic of the Summation Index - turned up gain, but should not last for long.
Bullish Percentage - buy signal, I expect lower high
Percent of Stocks above MA50 - heading higher, I expect another lower high.
Fear Indicator VIX - a lot of complacency and very tight BB. Volatility will rise sharply soon.
Advance-Decline Issues - one final spike to the overbought area will look great.
HURST CYCLES
I have explained last week about longer and shorter cycles and that I suspect a stealth wave 4 and 20 week cycle low behind us. I have adjusted the counts for shorter cycles.
Day 8 of the 40 day

Week 3 of the last 20 week cycle..... waiting for the 18 month cycle high.

Tom Demark SEQUENTIAL AND COUNTDOWN - this technique spots areas of exhaustion.
Still no price flip(sell signal) on the weekly chart. Day 6 of a setup on the daily chart... it will be interesting if it will be finished, than we will have a finished 9-13-9 on the daily and weekly chart.

Feb 4, 2017
Weekly preview
Short term view - more to the upside.
Intermediate term view - higher for 2-3 weeks then correction for 2 months.
This reversals surprised me.... but I do not think someone can predict them. I have not posted update because I was not sure about the pattern... second there is indexes with unfinished pattern(see the last chart) and I was not convinced that this is an important reversal. Currently I think we have stealth 20 week cycle low and the last wave up is running for 2-3 weeks before a bigger correction for 2 months. The indicators are turning up, market breadth is bearish but no problems for one final move for a few weeks,TomDemark sequential still with buy signal... so overall green light only waiting for confirmation. TECHNICAL PICTURE and ELLIOTT WAVES
Short term - this is the best I can come up with:) As long as the price does not move below the support area and finds support around MA200 the bulls are ok. DJ looks different so the pattern could be different... the indexes could just continue higher with simple pattern 1-2-3 running at the moment. As I said I am not 100% sure for the short term pattern.

Intermediate term - the indicators are turning up one final move up and divergences expected. I think that somewhere in this mess from the last two months there is wave 4 and 20 week cycle low(or it will come with the low for wave ii of the ED above).

Long term - no change, waiting for the wave from Feb.2016 to be finished.

MARKET BREADTH INDICATORS
The Market Breadth Indicators - the big picture is bearish with divergences, but short term no strong sell signal another 1-2 weeks higher for the indexes is not a problem.
McClellan Oscillator - making lower highs, but still positive.
McClellan Summation Index - no sell signal.
Weekly Stochastic of the Summation Index - turned lower, sell signal.
Bullish Percentage - sell signal, but still above 70, expecting lower high below 74.
Percent of Stocks above MA50 - move lower to the middle of the range and turned up, expecting a divergence.
Fear Indicator VIX - a lot of complacency and very tight BB. Volatility will rise sharply soon.
Advance-Decline Issues - one final run to the overbought area will look great.
HURST CYCLES
The previous two 20 week cycles were longer than the average, which usually means to expect shorter cycles after that. Looking back when we see longer 40 week cycle (37-38 weeks) the following one is shorter 25-30 weeks so I am expecting cycles with 11-15 weeks length. If the indexes just continue higher the 20 week cycle is behind us at week 11. If we see the ED playing out, the low will be next week with length 14. I will leave the counts below as they are and adjust them later if necessary. It is not so important to pinpoint the low just keep in mind that we have stealth 20 week cycle low and the next high will be the high of the 18 month cycle.
Day 23 of the 40 day cycle.
Week 13 of the 20 week cycle.
Tom Demark SEQUENTIAL AND COUNTDOWN - this technique spots areas of exhaustion.
Still no price flip(sell signal) on the weekly chart.
RUT - we have very choppy overlapping mess for almost two months. I do not see a way to twist this and say it is bearish we have a top and impulsive reversal. It is a classical "bull flag" and if I try to count the EW I would say this is iv of 3.
Intermediate term view - higher for 2-3 weeks then correction for 2 months.
This reversals surprised me.... but I do not think someone can predict them. I have not posted update because I was not sure about the pattern... second there is indexes with unfinished pattern(see the last chart) and I was not convinced that this is an important reversal. Currently I think we have stealth 20 week cycle low and the last wave up is running for 2-3 weeks before a bigger correction for 2 months. The indicators are turning up, market breadth is bearish but no problems for one final move for a few weeks,TomDemark sequential still with buy signal... so overall green light only waiting for confirmation. TECHNICAL PICTURE and ELLIOTT WAVES
Short term - this is the best I can come up with:) As long as the price does not move below the support area and finds support around MA200 the bulls are ok. DJ looks different so the pattern could be different... the indexes could just continue higher with simple pattern 1-2-3 running at the moment. As I said I am not 100% sure for the short term pattern.

Intermediate term - the indicators are turning up one final move up and divergences expected. I think that somewhere in this mess from the last two months there is wave 4 and 20 week cycle low(or it will come with the low for wave ii of the ED above).

Long term - no change, waiting for the wave from Feb.2016 to be finished.

MARKET BREADTH INDICATORS
The Market Breadth Indicators - the big picture is bearish with divergences, but short term no strong sell signal another 1-2 weeks higher for the indexes is not a problem.
McClellan Oscillator - making lower highs, but still positive.
McClellan Summation Index - no sell signal.
Weekly Stochastic of the Summation Index - turned lower, sell signal.
Bullish Percentage - sell signal, but still above 70, expecting lower high below 74.
Percent of Stocks above MA50 - move lower to the middle of the range and turned up, expecting a divergence.
Fear Indicator VIX - a lot of complacency and very tight BB. Volatility will rise sharply soon.
Advance-Decline Issues - one final run to the overbought area will look great.
HURST CYCLES
The previous two 20 week cycles were longer than the average, which usually means to expect shorter cycles after that. Looking back when we see longer 40 week cycle (37-38 weeks) the following one is shorter 25-30 weeks so I am expecting cycles with 11-15 weeks length. If the indexes just continue higher the 20 week cycle is behind us at week 11. If we see the ED playing out, the low will be next week with length 14. I will leave the counts below as they are and adjust them later if necessary. It is not so important to pinpoint the low just keep in mind that we have stealth 20 week cycle low and the next high will be the high of the 18 month cycle.
Day 23 of the 40 day cycle.

Week 13 of the 20 week cycle.

Tom Demark SEQUENTIAL AND COUNTDOWN - this technique spots areas of exhaustion.
Still no price flip(sell signal) on the weekly chart.

RUT - we have very choppy overlapping mess for almost two months. I do not see a way to twist this and say it is bearish we have a top and impulsive reversal. It is a classical "bull flag" and if I try to count the EW I would say this is iv of 3.

Subscribe to:
Posts (Atom)