
May 30, 2013
Short term update
Updated chart with the both options - simple A-B-C and the triangle. At this point is not possible to say what we will see..... but the main point is that this is corrective move and the index has unfinished businesses on the upside. Add to this that some indicators like McClellan Oscillator are oversold, the histogram has reseted and other indications that we are nearing short term bottom.

May 29, 2013

May 25, 2013
Weekly review
Short term view - 1-2 green days expected.
Intermediate term view - up until we see signs for anything else.
Trading system signal (swing trading) - Direction: UP | Last entry signal: at SP500=.... on xx.xx.xx | Stop at:
No surprises, up until FOMC and than sell off. Nothing scary for now.
The last two candles are bullish - they have touched MA20 on the daily chart and closed near the highs of the day. I think that we will see at least 1-2 green days. Even a new high is possible. The charts do not look bearish for the short term. For the intermediate term I am expecting one more push higher before a top - marginal new high, double top I do not know what exactly we will see.
TECHNICAL PICTURE
Short term - two scenarios we are in wave B from A-B-C the broken channel will be tested and another wave lower will follow with target 1600-1625. Or the highs will be tested before move lower.

- Triple cross(EMA10 and EMA20 crossing EMA50) - short term moving averages and price bellow EMA50. Short term direction is down but there is no really support from the daily chart. In this case the system says wait...
Intermediate term - the plan stays the same. Such parabolic moves are followed by by sharp sell off, which should not mark THE top.

- Trend direction EMA50/MACD - price is above EMA50 and MACD above zero so the intermediate term trend is still up.
- Momentum Histogram/RSI - momentum is down.The histogram is bellow zero and RSI broke its trend line, but it is often tested before the price moves lower.
Long term - the bigger picture has not changed. The bulls must be careful. We have bearish candle and momentum has turned down - histogram lower bar with divergence and RSI tested its broken trend line and turned down(see cycles weekly chart).

- Trend direction EMA50/MACD - price is above EMA50 and MACD above zero so the long term trend is up.
- Momentum Histogram/RSI - momentum points down, intermediate term trend change in the next weeks can not be ruled out.
MARKET BREADTH INDICATORS
The Market Breadth Indicators - show first cracks in this up move since April, but there is still no signs for a reversal.
McClellan Oscillator - very oversold outside its bollinger bands, which usually means expect several days in the opposite direction.
McClellan Summation Index - moved into sell mode... this sell off has some strength and this are these cracks which I am talking about.
Weekly Stochastic of the Summation Index - still shows buy signal, but in overbought territory and McClellan Summation Index turning lower. The swing is mature, we must be careful.
Bullish Percentage - buy signal, not very impressed with the selling.
Percent of Stocks above MA50 - dropped from very very extended levels but still above 75%.
Fear Indicator VXO - I think it is making a rounding bottom. Bollinger bands are very tight and I expect a jump in volatility. It will probably jump higher after a pullback and make higher low with divergence when the indexes make higher high in June.
Issues Advancing - the selling is broad based.
Issues Declining - the selling has strength, huge amount of shares is moving lower.
HURST CYCLES
I think we have 20 day cycle bottom and next week the next cycle should begin. I expect at least 1-2 green days even marginal new high is possible but not for a long time. The bigger cycle should override the smaller one and I expect move lower after that.

Week 13 of 20 week cycle. A sharp sell off for several weeks should mark the bottom of the 20 and 40 week cycle.

Tom Demark SEQUENTIAL AND COUNTDOWN - this technique spots areas of exhaustion.
On the daily chart we saw price flip - the first bearish sign for a long time:)
-----
Countdown at 9 and setup at 5. Another 3-4 weeks moving higher before a top... not impossible.

May 23, 2013
Short term update
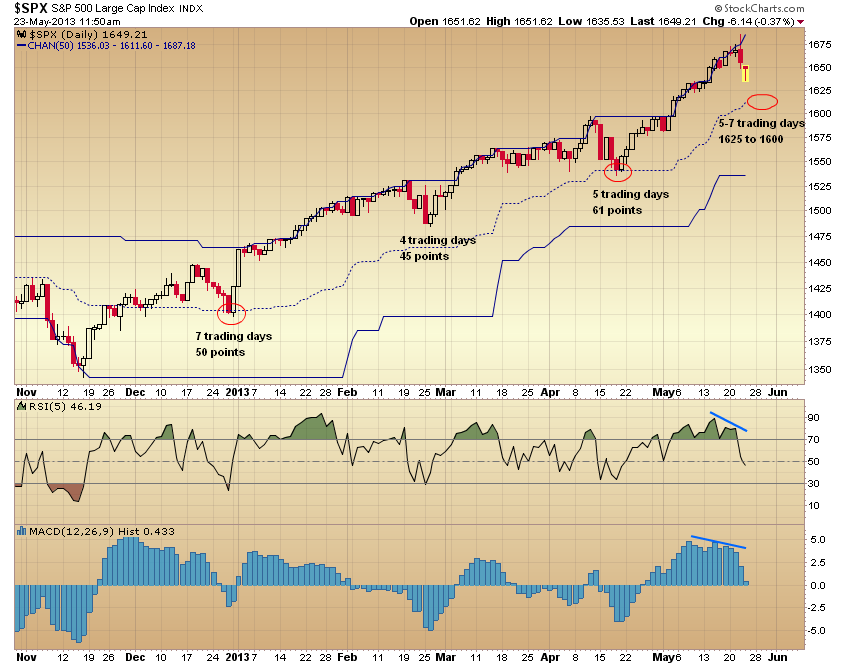
On the smaller time frames the move looks like impulse and we are in wave 4. If this is right than we should see something similar like on the chart bellow. The next support level is 1625.
On the daily chart we have important support level, MA50 and the trend line around 1600. I do not expect SP500 to move bellow this level without serious reaction on the upside.
 How the previous reactions looked like....

 How the previous reactions looked like....
May 22, 2013
Short term update
UPDATE: SPX500 climbing the stairs... and now taking the elevator:)
Roughly 30 points reversal from the high for now, FOMC often marks short term top/bottom, the indicators say the same, it looks like impulse 1-2-3 for now... So I think we have a short term top.
I think it is time to take profits...
SPX500 climbing the stairs... if it closes bellow support we will have ugly daily bearish candle, histogram divergence on the daily chart, MACD double divergence on the hourly chart. Short term target will be 1650.


May 21, 2013
Short term update
Nothing interesting. As expected crawling higher. I do not expect something to change before FOMC tomorrow.
May 18, 2013
Weekly review
Short term view - up until 1646 is breached.
Intermediate term view - up until we see signs for anything else.
Trading system signal (swing trading) - Direction: UP | Last entry signal: at SP500=.... on xx.xx.xx | Stop at:
Nothing really to write about in the last several weeks up is up. Everything was in place technical indicators, market breadth indicators, cycles, market behavior... and instead the begging of a correction we saw parabolic move higher. I wrote that if a correction does not start soon we will see euphoria stage and something between 1650-1700 - well we are in the middle of it.
Fast walk through the blogs show that the most people see only up,up,up. What I have read - it is 1995 and several years rally will follow(my opinion we are in secular bear not in secular bull), we are in 3 of 3 of 3 up to 1900-2000(show me an impulse since 2009, that it is not serious), this is an inflation pop to 2200-2300(really? why gold is moving lower and the USD higher?).
I think we are in an euphoria stage, but there is more upside. It takes time, the sentiment will not reverse abruptly, the history seem to support this(see the long term chart my forecast). We will know who is right(I or the supper bulls) at least after 3 to 6 months. In fact it is not important who is right or not, it is important to make some profits. My mistake was to concentrate too much on analysis and logic and I have forgotten to follow the system. There is such moments with serious disconnection between analysis and trading, but there is no parabolic phase which makes sense.
The plan for the next week(s) and months is simple to follow the market. Trading - follow the system and ignore logic that is the most important. Analysis and forecast - is shown on the long term chart it will be nice but not important to be right. Important and nice will be to make some profits. Short term - before seeing the price bellow 1646 forget about something bearish and I think that any drop in the next week or two should be bought.
Intermediate term - before seeing the price bellow 1500 the forecast for higher high stays the same.
TECHNICAL PICTURE
Short term - I have no idea about the short term. Just watching the last minor support level around 1646. If it is broken probably a bigger pullback will start. If this happens the price will move bellow the trend line and EMA50 too so the odds are high that a pullback 40-50 points is really under way.

- Triple cross(EMA10 and EMA20 crossing EMA50) - short term moving averages and price above EMA50. Short term direction is up.
Intermediate term - any drop should end above MA50 and the trend line and at least one more move up is to expect before significant correction, even if it is only retest of the high or minor higher high. For a subsequent correction we will think when the time comes.

- Trend direction EMA50/MACD - price is above EMA50 and MACD above zero so the intermediate term trend is up.
- Momentum Histogram/RSI - momentum is up.
Long term - In my previous post, I have wrote about similar rallys for the last two bull markets. The chart shows these two occasions and what happened after that. My forecast without looking back the charts was:
- first - the markets do not top on strength and after correction to expect higher high.
- second - such long lasting rallys exhaust the bull, there is too much greed and it burns its energy too fast. After higher high a significant move lower should start.
The history seems to support my view so I do not see a reason to change it. Do not forget that this is a weekly chart and the markets topped in the first occasion 9 months later and in the second occasion 6 months later. On the chart is marked and the top in 2010. Notice that we had long rally, correction and higher high - similar behavior. Notice the MACD divergence in all three occasions too. So focus on the intermediate term - correction probably in June and higher high. It is way too early to be bearish.
- Trend direction EMA50/MACD - price is above EMA50 and MACD above zero so the long term trend is up.
- Momentum Histogram/RSI - momentum is up.
MARKET BREADTH INDICATORS
The Market Breadth Indicators are all in buy mode. Yes the swing is mature most of them are in overbought territory, but still there is nothing to worry about. Only the McClellan Oscillator shows serious divergences in the last two weeks. Probably a pull back should be expected.
McClellan Oscillator - serious divergences, a pullback should be in the cards.
McClellan Summation Index - in buy mode.
Weekly Stochastic of the Summation Index - buy signal, but in overbought territory already. The swing is mature, but several weeks before a top are not a problem.
Bullish Percentage - buy signal, nothing to worry about.
Percent of Stocks above MA50 - strong at 93, nothing to worry about.
Fear Indicator VXO - I think it is making a rounding bottom. It will probably jump higher after a pullback and make higher low with divergence when the indexes make higher high in June.
Issues Advancing - in the last weeks the index is advancing but the advancing issues are declining. Time for a pullback?
Issues Declining - in the last weeks the index is advancing but the declining issues too. Time for a pullback?
Put/Call Ratio - Option players are extremely bullish again, bu the tops follow several weeks later. That is my view too.
HURST CYCLES
At day 21 it should turn lower soon... but who knows.

Another week higher 12 in the 20 week cycle.... If there is a correction it should not last long 3-4 weeks. This should be a 40 week cycle low and another strong rally should start.

Tom Demark SEQUENTIAL AND COUNTDOWN - this technique spots areas of exhaustion.
It is not worth posting a chart... setup,combo,countdown one after the other.. even on the weekly chart, really crazy. There is no point to look for an exhaustion on the daily chart in this environment with TD Sequential.
A lot of setups,combos,countdowns... Another setup has begun in April currently at 4. Combo from the previous setup has finished and the countdown is at 8. It is difficult to predict if they will be finished before a correction. For now the answer is yes.

Intermediate term view - up until we see signs for anything else.
Trading system signal (swing trading) - Direction: UP | Last entry signal: at SP500=.... on xx.xx.xx | Stop at:
Nothing really to write about in the last several weeks up is up. Everything was in place technical indicators, market breadth indicators, cycles, market behavior... and instead the begging of a correction we saw parabolic move higher. I wrote that if a correction does not start soon we will see euphoria stage and something between 1650-1700 - well we are in the middle of it.
Fast walk through the blogs show that the most people see only up,up,up. What I have read - it is 1995 and several years rally will follow(my opinion we are in secular bear not in secular bull), we are in 3 of 3 of 3 up to 1900-2000(show me an impulse since 2009, that it is not serious), this is an inflation pop to 2200-2300(really? why gold is moving lower and the USD higher?).
I think we are in an euphoria stage, but there is more upside. It takes time, the sentiment will not reverse abruptly, the history seem to support this(see the long term chart my forecast). We will know who is right(I or the supper bulls) at least after 3 to 6 months. In fact it is not important who is right or not, it is important to make some profits. My mistake was to concentrate too much on analysis and logic and I have forgotten to follow the system. There is such moments with serious disconnection between analysis and trading, but there is no parabolic phase which makes sense.
The plan for the next week(s) and months is simple to follow the market. Trading - follow the system and ignore logic that is the most important. Analysis and forecast - is shown on the long term chart it will be nice but not important to be right. Important and nice will be to make some profits. Short term - before seeing the price bellow 1646 forget about something bearish and I think that any drop in the next week or two should be bought.
Intermediate term - before seeing the price bellow 1500 the forecast for higher high stays the same.
TECHNICAL PICTURE
Short term - I have no idea about the short term. Just watching the last minor support level around 1646. If it is broken probably a bigger pullback will start. If this happens the price will move bellow the trend line and EMA50 too so the odds are high that a pullback 40-50 points is really under way.

- Triple cross(EMA10 and EMA20 crossing EMA50) - short term moving averages and price above EMA50. Short term direction is up.
Intermediate term - any drop should end above MA50 and the trend line and at least one more move up is to expect before significant correction, even if it is only retest of the high or minor higher high. For a subsequent correction we will think when the time comes.

- Trend direction EMA50/MACD - price is above EMA50 and MACD above zero so the intermediate term trend is up.
- Momentum Histogram/RSI - momentum is up.
Long term - In my previous post, I have wrote about similar rallys for the last two bull markets. The chart shows these two occasions and what happened after that. My forecast without looking back the charts was:
- first - the markets do not top on strength and after correction to expect higher high.
- second - such long lasting rallys exhaust the bull, there is too much greed and it burns its energy too fast. After higher high a significant move lower should start.
The history seems to support my view so I do not see a reason to change it. Do not forget that this is a weekly chart and the markets topped in the first occasion 9 months later and in the second occasion 6 months later. On the chart is marked and the top in 2010. Notice that we had long rally, correction and higher high - similar behavior. Notice the MACD divergence in all three occasions too. So focus on the intermediate term - correction probably in June and higher high. It is way too early to be bearish.

- Trend direction EMA50/MACD - price is above EMA50 and MACD above zero so the long term trend is up.
- Momentum Histogram/RSI - momentum is up.
MARKET BREADTH INDICATORS
The Market Breadth Indicators are all in buy mode. Yes the swing is mature most of them are in overbought territory, but still there is nothing to worry about. Only the McClellan Oscillator shows serious divergences in the last two weeks. Probably a pull back should be expected.
McClellan Oscillator - serious divergences, a pullback should be in the cards.
McClellan Summation Index - in buy mode.
Weekly Stochastic of the Summation Index - buy signal, but in overbought territory already. The swing is mature, but several weeks before a top are not a problem.
Bullish Percentage - buy signal, nothing to worry about.
Percent of Stocks above MA50 - strong at 93, nothing to worry about.
Fear Indicator VXO - I think it is making a rounding bottom. It will probably jump higher after a pullback and make higher low with divergence when the indexes make higher high in June.
Issues Advancing - in the last weeks the index is advancing but the advancing issues are declining. Time for a pullback?
Issues Declining - in the last weeks the index is advancing but the declining issues too. Time for a pullback?
Put/Call Ratio - Option players are extremely bullish again, bu the tops follow several weeks later. That is my view too.
HURST CYCLES
At day 21 it should turn lower soon... but who knows.

Another week higher 12 in the 20 week cycle.... If there is a correction it should not last long 3-4 weeks. This should be a 40 week cycle low and another strong rally should start.

Tom Demark SEQUENTIAL AND COUNTDOWN - this technique spots areas of exhaustion.
It is not worth posting a chart... setup,combo,countdown one after the other.. even on the weekly chart, really crazy. There is no point to look for an exhaustion on the daily chart in this environment with TD Sequential.
A lot of setups,combos,countdowns... Another setup has begun in April currently at 4. Combo from the previous setup has finished and the countdown is at 8. It is difficult to predict if they will be finished before a correction. For now the answer is yes.

May 16, 2013
Some thoughts
What the history tels us - bellow are the occasions from the bull market 2003-2007 and the current bull market when we had similar moves like
the current one - longer than 120 trading days without any correction(6% or bigger sell off):
06.Aug 2003 - 08.Mar 2004 - 159 TD - 20,5% -> very long sideway move (at the begging of the bull market)
18.Jul 2006 - 22.Feb 2007 - 155 TD - 20% -> sharp and short living correction and final rally before bear market
27.Aug 2010 - 18.Feb 2011 - 121 TD - 29% -> sharp and short living correction and final rally before severe drop
I think the last two occasions are relevant and we will witness something similar(the first one appeared when the bull was still very young).
How the indicators looked like:
- on the daily chart no signs for trouble, no double tops or retest of the high, no MACD divergence..... nothing.
- on the weekly chart - RSI extreme and histogram divergence
- the sell offs were very sharp, came suddenly from nowhere, everybody is rushing trough the exits.
Current rally 16.Nov 2013 - still running - 120 TD - 23,7%
Now the indicators daily and weekly show the same picture and the current move looks even parabolic compared to the other two.
It is interesting that without knowing my forecast mirrors what history says. It will not repeat 1:1 but it will rhyme.
So I do not see a reason to change my forecast - one day suddenly a sharp correction will start but for 3-4 weeks followed by another rally which should be either the end of the bull market or important top before severe correction of 20%-25%. That is what the history says, let's see if it will repeat.
May 15, 2013
Short term update
It is bullish, more bullish than I expected... but it is getting too stretched on the upside and starts looking parabolic. On the weekly and daily chart the price is way too far from EMA50 and I expect snap back first on the daily chart and probably in June larger correction. Be patient, it is early for shorts, taking some profits is probably not a bad idea.


May 13, 2013
Short term update
SP500 touched the upper channel and this up leg since 19 April looks like it is close to its end. On the other side there is no signs that this is an intermediate top so after a drop 30-40 points I expect to see another move higher. The German DAX shows similar picture. DJ looks a little bit different - there is still MACD divergence on the daily chart(SP500 erased its divergence) and RSI/Histogram divergence on the weekly chart which means intermediate term correction is around the corner. We will watch this closely
My mistake was focusing too much on analysis and less on trading and signals. Instead wondering if this is a top, what kind of top etc. the approach will be practical - this up leg looks mature and the price is again too far from MA50 on the daily chart. That means we should see a pause or a small pullback to the trend line/MA50 and another up leg should start. Than we will watch how it develops and for potential signs of weakness before calling an intermediate term top.


Subscribe to:
Posts (Atom)