Apr 14, 2017

Update

I am taking a break for two weeks. The next weekly update will be on 6th of Mai... probably I will post a short update on 2/3th of Mai.
I do not expect dramatic changes... the "surprise" could be if the correction is finished in the next two weeks which is the short end of this time frame which I am counting currently at 2-4 weeks, so not really a surprise.

It is like in November, it is a correction - constantly changing short term moves and a lot of combinations possible. I have shown below two options. There is at least other two scenarios - wave d of a triangle which suggest the same higher, but the final leg lower will not make lower low or another scenario just plunging lower. I think it is more likely to see mid-cycle low of the 40 day cycle instead of a plunge and I would like to see a fear for the last leg lower so I show the scenarios which I prefer.

Some would say not very helpful so many options... I would say if you focus on following the moves on short term basis you are missing the important messages. The important messages is - it is a correction and after a correction another rally follows. The exact shape of the correction is info just for the statistic.
The price action seems to confirm my analysis - the move lower will last at least 9-10 weeks(important cycle low expected 18 month) and at week 7 we have 3-4 possible patterns which means this is just a correction.

The wave lower is already running, some retracement to resistance/MA50/MA200 and final leg lower.

Flat correction for B and final leg lower C. If it is a triangle instead of B this is will be d and e to around 2330 instead of C/4

Apr 11, 2017

Update

At the moment I see this pattern... complex wave B. It is too early in the cycle to see a plunge.

Apr 7, 2017

Weekly preview

Short term view - higher next week.
Intermediate term view - the correction to continue for 3-5 weeks.

We saw the price higher until Wednesday as expected, now it is more complicated.... most of the indexes have different patterns which makes me crazy:) and difficult to forecast the short term:
- Nasdaq finished wave iii of 3 and we have impulse lower followed by a-b-c (Thursday-Friday)... difficult to see some rally higher.
- XLF looks like flat b of B so next week should be higher to finish the correction(last chart).
- SP500/NYSE look more like XLF, DJ more like Nasdaq...
- Europe is strange three waves down and up but different picture - DAX with lower high/CAC with higher high/EUROSTOXX50 is testing the high....

We have short trading week and Easter. How can the big boys make more money? I think we will see pump before the long weekend(to scare shorts) and dump after the holidays(the correction taking it's course). Such scenario fits much better with cycles than the start of a sell off next week. Overall typical behavior for a correction at this stage of the pattern - long sideway move and sudden sell off(expected) for two weeks to finish the correction.


TECHNICAL PICTURE and ELLIOTT WAVES
Short term - SP500 looks better like wave b of B.... nothing lower after the plunge from Wednesday. Alternate scenario is the red one - lower on Monday, but retracing higher for the rest of the week.


Intermediate term - the index finds support at MA50, the oscillators are resetting... waiting for a few days higher.


Long term - no change, waiting for the wave from Feb.2016 to be finished.


MARKET BREADTH INDICATORS
The Market Breadth Indicators - pointing higher, this is just shore term move the signal for a bottom should come later in a few weeks.
McClellan Oscillator - making lower high, we should see another big red trough.
McClellan Summation Index - buy signal.
Weekly Stochastic of the Summation Index - buy signal.
Bullish Percentage - still above 70.
Percent of Stocks above MA50 - in the middle of the range.
Fear Indicator VIX - continue making higher lows, it looks like it wants to explode higher.

HURST CYCLES
Day 9 of the last 40 day cycle. Almost 1/4 is behind us it is obviously weaker than the previous daily cycles.

Week 11 of the last 20 week cycle. Expecting to see 18 month cycle low in the first half of May.


XLF looks like flat for b of B.... one more push higher to the trend line and MA200 will look great.

Apr 5, 2017

Update

It looks dangerous for the bulls..... Nasdaq 10 min chart this looks to me like the top of wave iii of 3.
One small push tomorrow is possible, but if you are long do not rely on this. SP500 looks the same way only this is the top of wave b or 2.


The daily chart - the leader looks tired with MACD double divergence.

Apr 1, 2017

Weekly preview

Short term view - wave b continuation next week.
Intermediate term view - the correction to continue for 4-6 weeks.

We saw one more low and short term bottom for the 40 day cycle - no surprises, but not clear pattern. I can not say - 100% we will see lower high.
DAX and Nasdaq look like final fifth wave higher with iv and v missing. XLF (last chart) is showing clear pattern now in b of B.
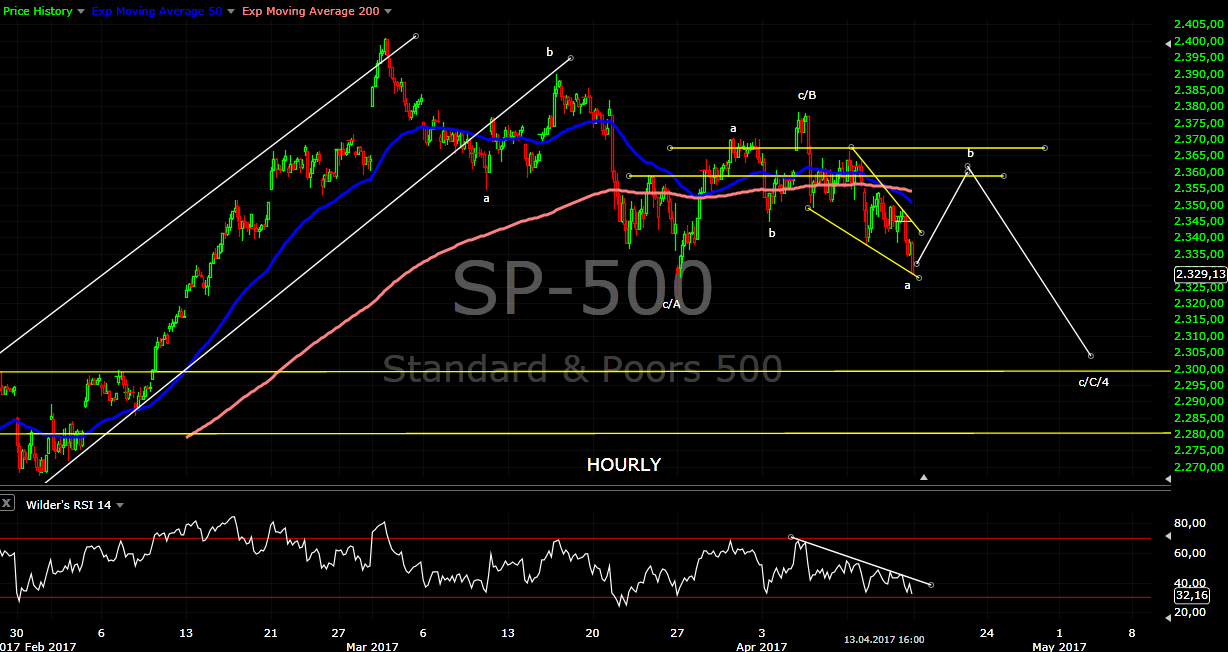
If SPX/DJ follow the same pattern like DAX / XLF / Nasdaq we should see (b) and (c) from b so I expect lower high for SPX.


TECHNICAL PICTURE and ELLIOTT WAVES
Short term - we have one leg higher which looks like an impulse so more to the upside expected. If it is wave b it should not move above the resistance zone and reverse sharply...


Intermediate term - the index needs more time for the histogram to reset. If we see higher high I do not think this will be the beginning of a new leg higher just (v) of iii or 3.


Long term - no change, waiting for the wave from Feb.2016 to be finished.


MARKET BREADTH INDICATORS
The Market Breadth Indicators - turned higher, but short term not like expect move up for months.
McClellan Oscillator - buy signal.
McClellan Summation Index - buy signal.
Weekly Stochastic of the Summation Index - in oversold territory, it should spend there several weeks.
Bullish Percentage - sell signal, but still above 70.
Percent of Stocks above MA50 - turned up in the middle of the range.
Fear Indicator VIX - continue making higher lows, the surprise will be to the downside for stocks.

HURST CYCLES
40 day cycle low behind us and day 4 of the next and last 40 day cycle before 18 month cycle low.

Week 10 of the last 20 week cycle. Expecting to see an important top soon and 18 month cycle low first half of May.


Tom Demark SEQUENTIAL AND COUNTDOWN - this technique spots areas of exhaustion.
No price flip up, still sell signal and the histogram pointing lower.... no bullish signs despite the bullish candle.


I think XLF shows clear picture what is going on. Very clear waves and pattern, I will be very surprised if it does not find resistance at MA200 and reverses lower.