Oct 26, 2019

Weekly preview

Another slow motion week, as I wrote probably waiting for FOMC. Despite the boring price action a lot of happened this week - the pieces one by one are falling into place (the last charts below).
No change - I think we have complex combination for b/B which begun late April/early May(depends on the index), a-b-c higher begun in August and it is close to completion. If I am right next we should see sell off for 2-3 weeks.


TECHNICAL PICTURE and ELLIOTT WAVES
Short term - the bullish hope triangle wave d is history, five wave looking move with a high above the supposed wave c.
This is a-b-c from the August low.

NDX 4h has more clear picture - I see clear impulse higher to complete wave c of a zig-zag. RSI confirms it with five waves higher, w4 breaking the trend line and w5 testing it. Intermediate term multiple divergences and sell off expected.


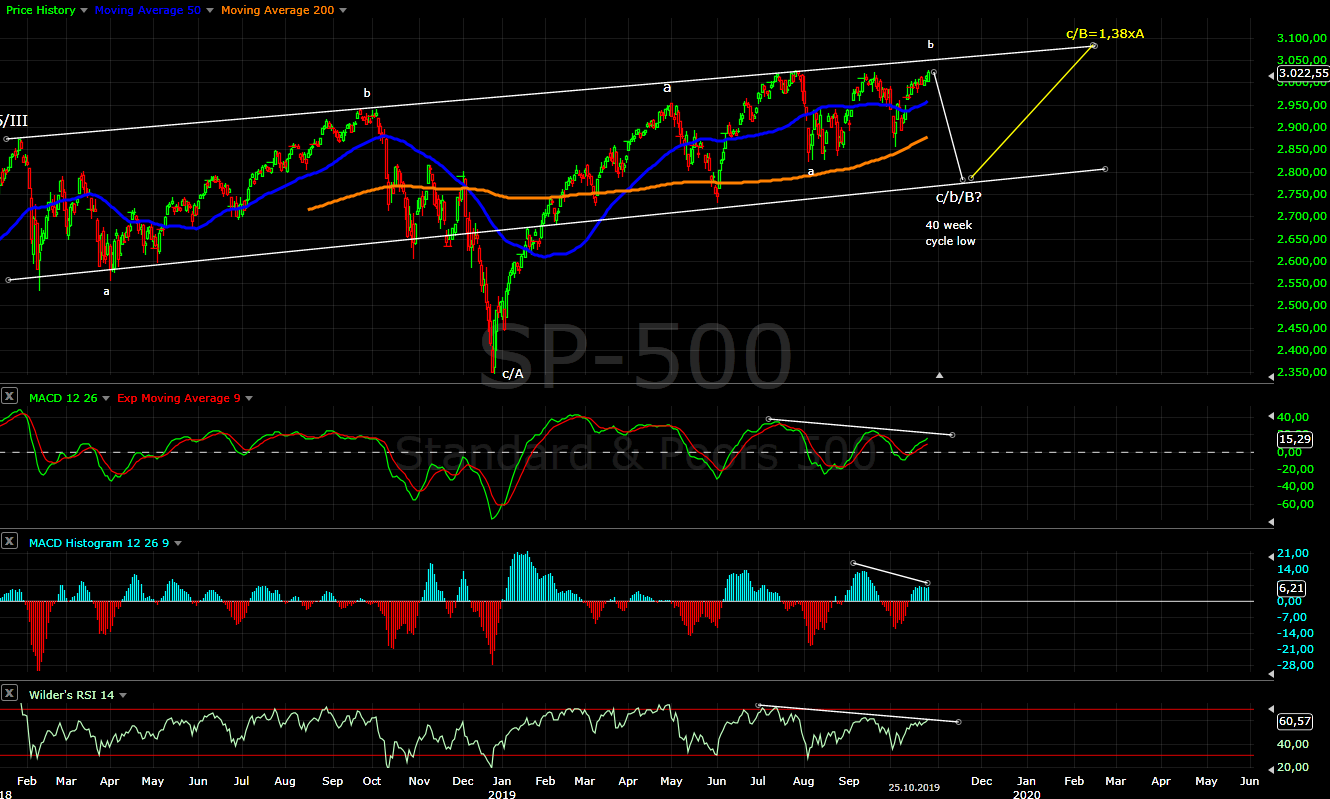
Intermediate term - I have posted a chart in comments last week explaining what I see. For me we have one big b/B which begun in May. Why? because it fits every index and chart I look at(see the last charts)
Three months wave a/b/B flat, 3 months b/b/B zig-zag and now it is time for c/b/B lower.


Long term - at the moment I expect a correction to be finished around mid-November. Then a rally for 3 months followed by final sell off to finish the correction which begun in 2018..


MARKET BREADTH INDICATORS
Market Breadth Indicators - turned up, but I do not see signs for important low.... more likely resetting and divergences before the final sell off.
McClellan Oscillator - above zero, but weak with short term and intermediate term divergences.
McClellan Summation Index - turned up, buy signal, but divergences.
Weekly Stochastic of the Summation Index - making a pause.
Bullish Percentage - turned up.
Percent of Stocks above MA50 - below overbought level, does not show much conviction .
Fear Indicator VIX - close to a low around 12 and spike higher expected.
Advance-Decline Issues - trying to reach the overbought level, does not show much conviction and divergence.


HURST CYCLES
Day 50 for the daily cycle(80 day Hurst cycle).


Week 21, expect sharp sell off for 2-3 weeks.


XLF shows more clear the big picture - clear zig-zag for a/B until late April, not like SP500/NDX where some try to count an impulse. From May the pattern which I am explaining for a few weeks b/B and if I am right in November we will see c/B.
I do not see impulse from Dec.2018, I do not see a reversal pattern so we are in the middle of a B wave.


EEM exactly the same story the only difference is we do not see higher highs. Corrective zig-zag until late April a/B. The following overlapping waves do not look like strong wave C reversal... it is zig-zag lower into August and zig-zag higher now - the same like SP500. The most likely outcome is again c/b/B and one more rally to finish c/B.


VIX is completing wave 5/c for a zig-zag and all this at the trend line which started two years ago. Surprise surprise the same patterns like the indexes. It is getting boring but again a-b-c from April to August, now another a-b-c lower to test the trend line and spike higher for c expected.


Crude oil has high correlation with the indexes since 2018 and despite the pattern looking different at the end it is the same. Sell off the last three months of 2018, corrective rally until April and now some corrective crap is running, no way this is reversal for wave C. Zig-zag lower into August, zig-zag higher into September and after that the pattern is different, but the outcome should be the same b/B. When there is no reversal crude oil should be in the middle of wave B.

Oct 19, 2019

Weekly preview

Nothing new this week, I have the feeling the market is waiting for FOMC the end of the month. The short term and intermediate term pattern is a mess.
With this corrective waves I can show at least 4-5 different patterns. I have seen three different versions just for a triangle and I will not start with EDs:)
My feeling tells me we should see more to the upside short term to finish some kind of b wave followed by a final sell off to finish b/B.


TECHNICAL PICTURE and ELLIOTT WAVES
Short term - is it still wave c or w3 and now 4(green)? Or this is part of a bigger zig-zag(yellow)?
The bulls see triangle(white) and this zig-zag is wave d... this is just one version of a triangle.
Other see ending diagonals some wave 1 other 3 or even w5....
And I have different opinion, we will see in the next 2-3 weeks who is right:)


Intermediate term - looking time, the indicators and other markets, the best fit for me is a sell off to finish corrective pattern from the July high. The size off the move will tell us if this is b/B or B is finished.


Long term - at the moment I expect a correction to be finished around mid-November. Then a rally for 3 months followed by final sell off to finish the correction which begun in 2018.


MARKET BREADTH INDICATORS
Market Breadth Indicators - I do not see signs for important low... I think we are in the middle of some pattern.
McClellan Oscillator - above zero.
McClellan Summation Index - starting to turn higher.
Weekly Stochastic of the Summation Index - sell signal.
Bullish Percentage - starting to turn high.
Percent of Stocks above MA50 - nothing interesting in the mid-range.
Fear Indicator VIX - one final low to test the long term trend line and another spike.
Advance-Decline Issues - heading higher, even if it reaches overbought levels we will see divergence.


HURST CYCLES
Day 45 for the daily cycle(80 day Hurst cycle).


Week 20... if the 40 week low was not in August, expect sharp sell off for 2-3 weeks.

Oct 12, 2019

Weekly preview

I see another zig-zag - two legs higher with the same size, so the corrective price action continues.
Nothing new, the same analysis like last week - final sell off expected into the end of the Month for 40 week cycle low and higher for 2-3 months. Looking at different indexes or crude oil for example, I think b/B is running.


TECHNICAL PICTURE and ELLIOTT WAVES
Short term - another corrective move, even if it somehow extends higher I do not think this is an impulse.


Intermediate term - from the low in August the move looks like some kind of corrective b wave. I expect one more sell off to complete the correction which begun late July - most likely 40 week cycle low and at least the lower trend line should be tested.
For something bearish price should break below it.


Long term - at the moment I expect a correction to be finished late October/ early November. Then a rally for 2-3 months followed by final sell off to finish the correction which begun in 2018.


MARKET BREADTH INDICATORS
Market Breadth Indicators - the oscillators are resetting from slightly oversold levels and trend following indicators are in the middle of a decline. We should see at least one more sell off to suggest intermediate term low.
McClellan Oscillator - resetting from slightly oversold leveland now positive.
McClellan Summation Index - sell signal.
Weekly Stochastic of the Summation Index - sell signal.
Bullish Percentage - turned up, in the middle of the range.
Percent of Stocks above MA50 - turned up, in the middle of the range.
Fear Indicator VIX - turned lower, but I expect one more spike.
Advance-Decline Issues - turned up, in the middle of the range.


HURST CYCLES
Day 40 for the daily cycle.


Week 19 for the 20 week cycle.

Oct 5, 2019

Weekly preview

A lot of volatility and another corrective a-b-c. It is complete mess corrective waves in both directions and too many possible patterns. With cycles it is not 100% clear either. The two main options are this consolidation and when it is over continuation higher or topping pattern is running. At the moment it is difficult to say with very high probability which one it is. What I think I know:)
- Consolidation - I want to see finished pattern lower with final impulse wave c, 40w cycle low around the end of October, market breadth signaling intermediate term low. There is no such signals and small a-b-c lower does not look enough for me.
- Topping - I want to see finished pattern and reversal with impulse. The zig-zag from September is not enough so at least one more high is missing.

No matter bullish(consolidation) or bearish(topping) both cases do not look complete. At the moment I am just watching no need to guess. I will assume it is consolidation, than we should see another 2-3 weeks lower and a low below the August lows for a finished corrective pattern.


TECHNICAL PICTURE and ELLIOTT WAVES
Short term - corrective zig-zag higher in September, this decline is another a-b-c my suspicion was confirmed. I will make a guess - this rocket launch is another corrective zig-zag:))).
If we see test of the high with another zig-zag(c=a red) it will be dangerous for the bulls see the third chart. In this case the bulls must hope this is triangle and not ED.


Intermediate term - lower as expected, but I can not see finished pattern and reversal. to the upside the price is testing resistance/MA50 and the gap was closed. In the case of consolidation another decline should follow to test the lower trend line. 40 week cycle low should be followed by 2-3 months higher and test of the upper trend line.... in this case the 1,38 Fibo level will be hit, which is usual extension for B waves in expanded flat.

For something bearish the lower trend line(shown above) should be broken and at least the March/June lows tested. Here is one bearish pattern... who knows with so many zig-zags. In this case B=1,23xA the other usual extension for expanded flat.


Long term - at the moment I will assume that a correction will be finished in October. Then a rally for 2-3 months followed by final sell off to finish the correction which begun in 2018.


MARKET BREADTH INDICATORS
Market Breadth Indicators - oscillators turned up signaling short term bottom, but no signs for important low.
McClellan Oscillator - slightly oversold and turned higher, close to zero now.
McClellan Summation Index - sell signal.
Weekly Stochastic of the Summation Index - sell signal, turned lower from overbought levels.
Bullish Percentage - sell signal.
Percent of Stocks above MA50 - turned up in the middle of the range.
Fear Indicator VIX - retracement and one more spike expected.
Advance-Decline Issues - oversold levels has not been reached, now around the middle of the range.


HURST CYCLES
This low is another option for 40 week cycle low - 10 weeks from June to 5th of August and 8 weeks from this August low until this week for 40 week cycle with length 41 weeks. The pattern and market breadth does not really signal an intermediate low, but who knows.

Day 35 another 2-3 weeks needed for finished daily cycle.


Week 18 for the 20 week cycle.