Trading cycle - still buy and very stretched in time. I suspect something unusual is going on(trading and Hurst cycles not in sync), but lets see if it will be confirmed.
This trading cycles are closely correlated to Hurst cycles, but not always exactly the same. And now is one such occasion. For trading counting from top to top it is one trading cycle, but from cycle theory perspective I think it is way too long for one daily cycle which is not even completed. It is more likely to have two 10w cycles 31+XX and 20w/40w cycle high, which means in July we have a low - 20w low.

TECHNICAL PICTURE and ELLIOTT WAVES
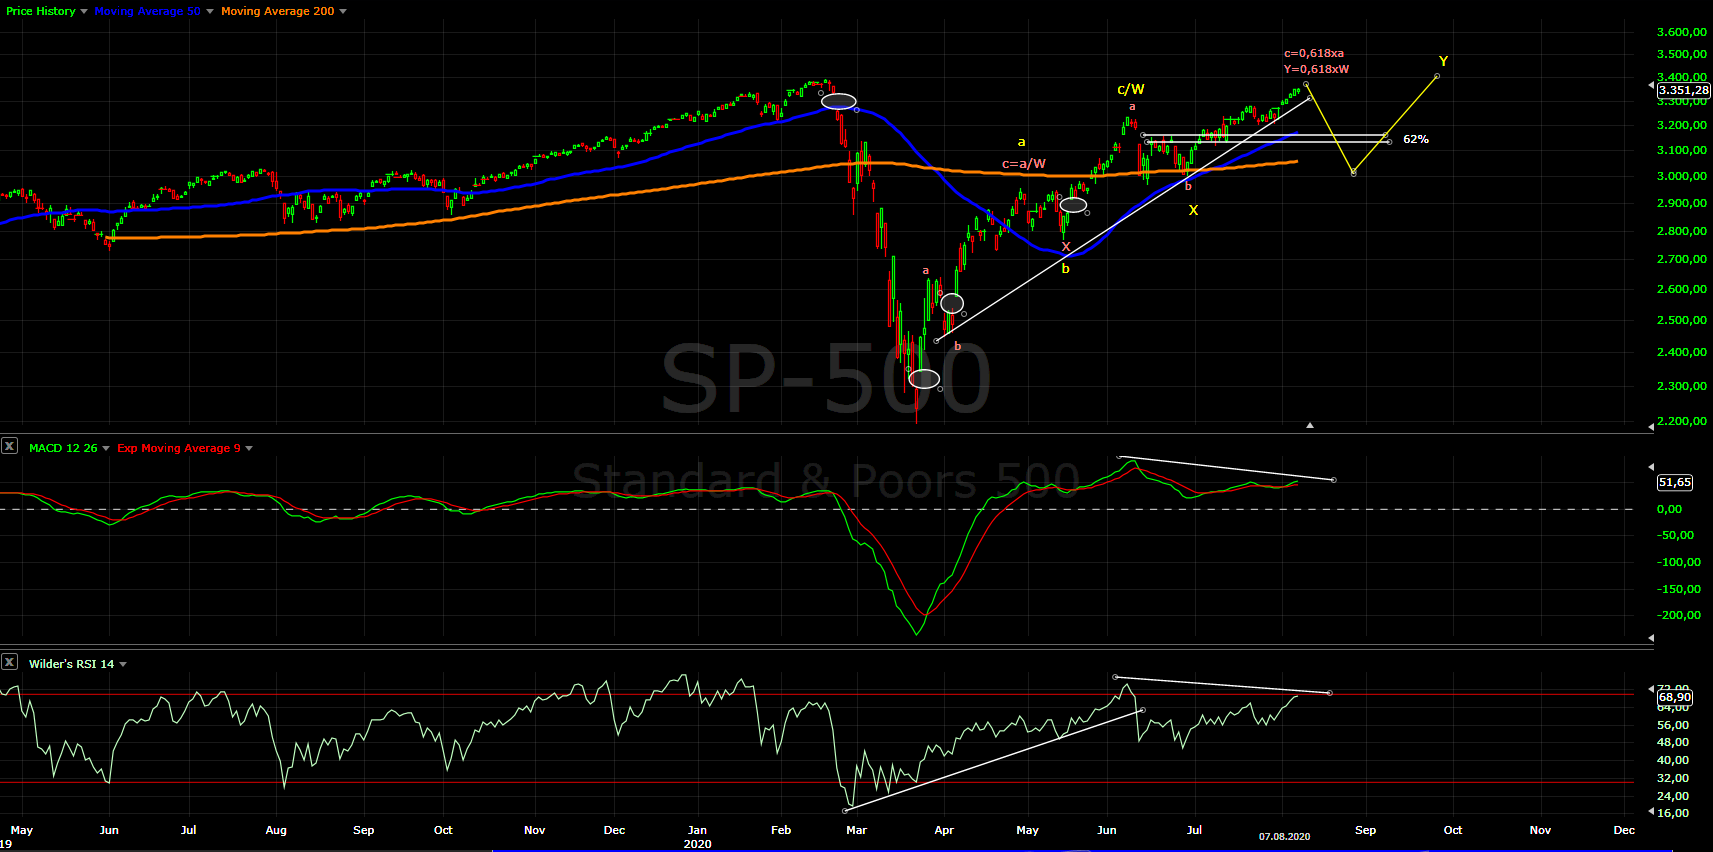
Short term - the only possible count is corrective and most likely w-x-y with c=1,618xa(red). Two more waves 4 and 5 needed to complete the pattern. Alternate is what I have shown last week 5/C... I just preffer to see RSI divergence.

Intermediate term - RSI there is no divergence and showing strength so the odds for 3/c are higher. I would wait for divergence on the hourly and daily chart or impulse to the downside to confirm reversal.

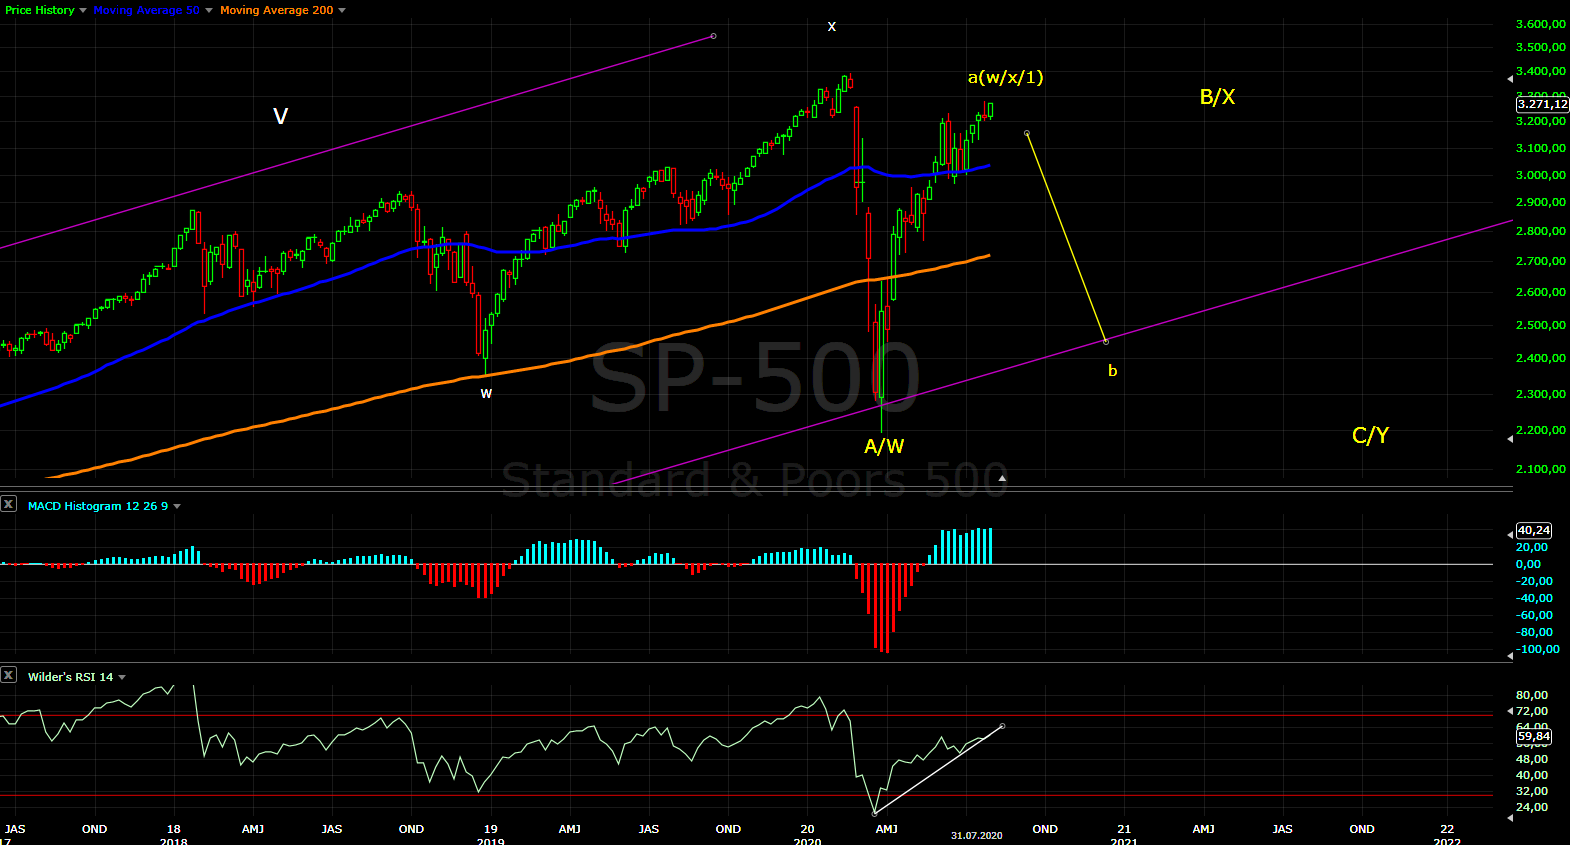
Long term - I think the bull market completed in 2018. Since then a bunch of corrective waves. Currently watching the pattern below wave a or x, but with corrective waves often you have to adjust so stay open minded.
We have another corrective wave - most likely scenario it is part of a bigger corrective pattern less likely wave X and another corrective pattern to follow.

MARKET BREADTH INDICATORS
Market Breadth Indicators - nothing new divergences and market breadth does not follow the price at all.
McClellan Oscillator - resetting toward the zero line, I expect pop above it before we see a top.
McClellan Summation Index - sell signal and divergence.
Weekly Stochastic of the Summation Index - sell signal and divergence.
Bullish Percentage - flat with divergence.
Percent of Stocks above MA50 - oscillating around 75 with divergence.
Fear Indicator VIX - bottoming as expected, grinding higher and ignores the indices.
Advance-Decline Issues - broke the trend line connecting the lows so the next move up will be the top.
HURST CYCLES
Short term cycles - it looks like 20d high as expected and next week we should see decline into 20d low. There is high probability the next 20d high could complete the 40w cycle high.

Week 5 or 9 for the 20w cycle. For now I follow the both counts and watch the further price action. We are close to 40w cycle high.

Tom Demark SEQUENTIAL AND COUNTDOWN - this technique spots areas of exhaustion.
Eight for a setup on the weekly chart - another week needed for finished setup. The previous wave W almost managed to complete setup too if you ignore the slight violation of the rule in middle:)