Trading trigger - buy signal.
Analysis - long term sell the rips, we have major top. Intermediate term high expected.
P.S. - for a trade both analysis and trigger should point in the same direction.

TECHNICAL PICTURE and ELLIOTT WAVES
Short term - some complex corrective pattern which is completed or close to completition. I see double zig-zag X-wave and another zig-zag.

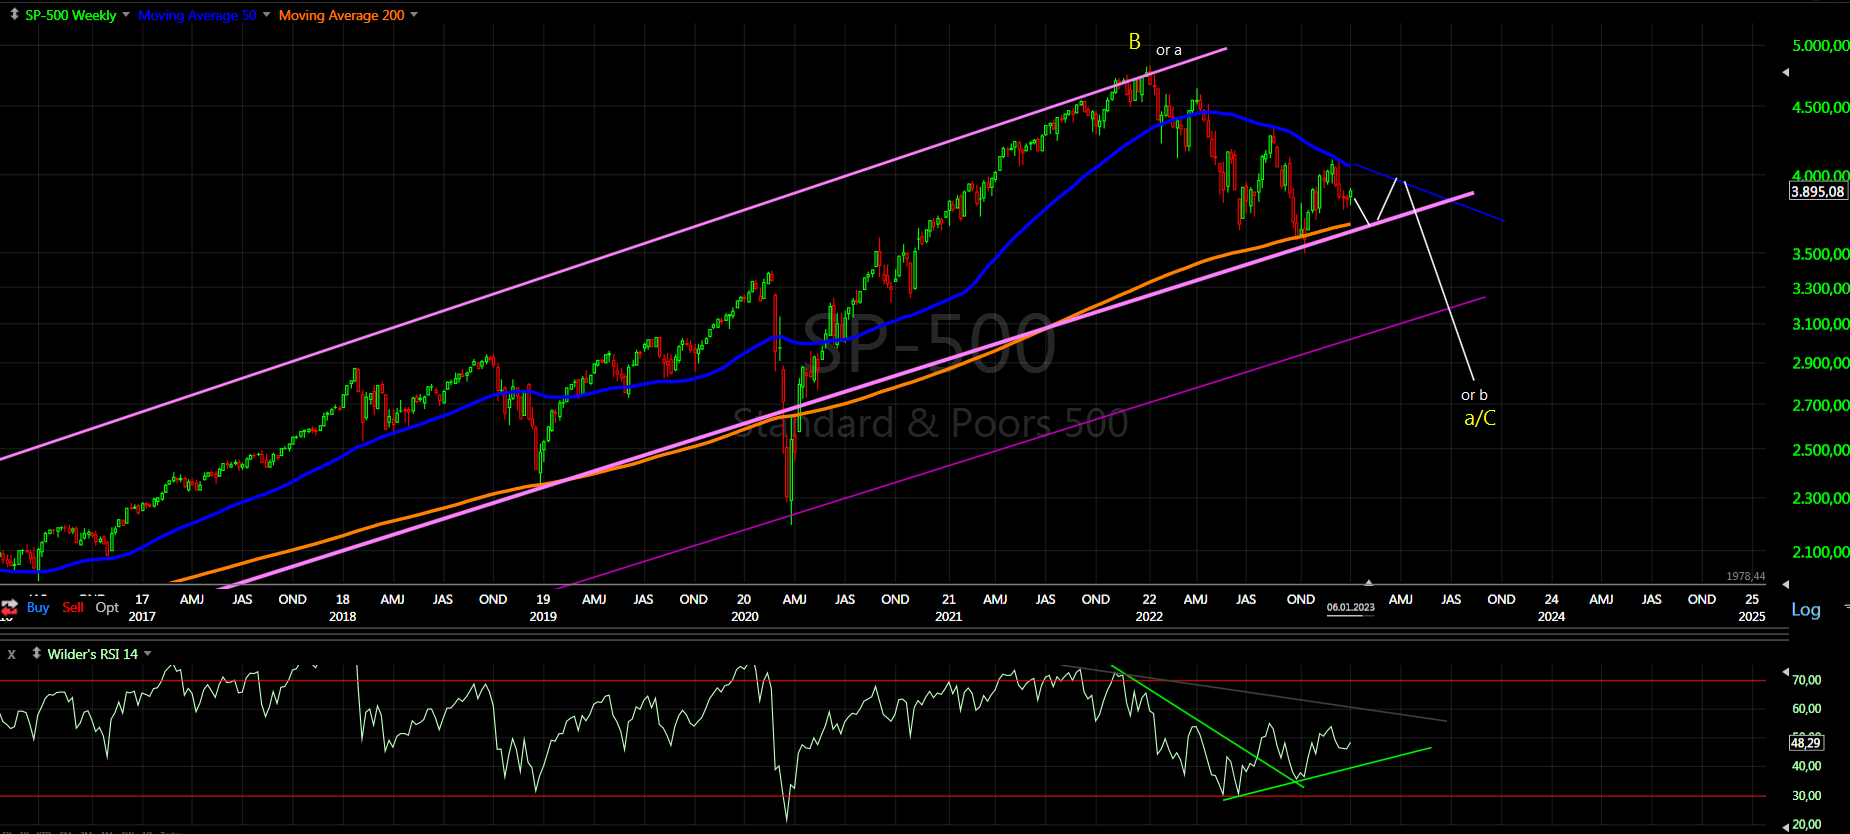
Intermediate term - removed the triangle does not look very likely. Added some labels for the decline - complex pattern zig-zag plus expanded flat. Interesting it works for most of the indices and synchronizes with the Eruopean indices. The more important question is - is this the high or later in two months? From cycle perspective a high in two months will fit perfect, but often it does not play out perfect just close enough. We can be sure only when we see the next decline.

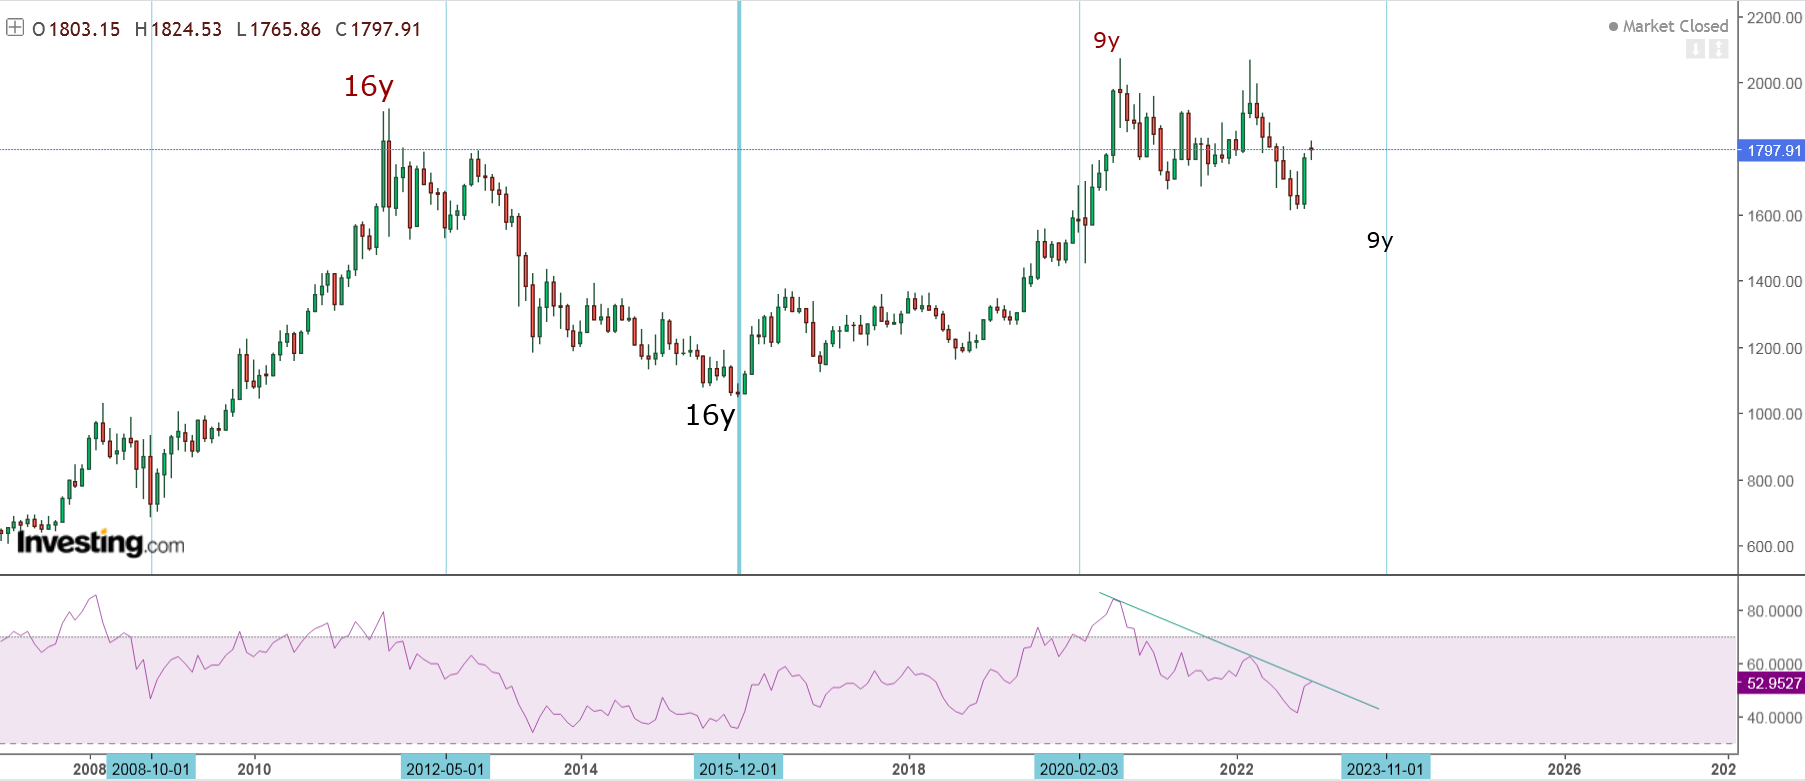
Long term - most likely huge double zig-zag from the 2009 low B-wave was completed and multi year decline has started. If we are lucky it is lower degree b-wave.

MARKET BREADTH INDICATORS
Market Breadth Indicators - showing weakness and lower highs.
McClellan Oscillator - lower highs and short term divergence.
McClellan Summation Index - buy signal.
Weekly Stochastic of the Summation Index - buy signal.
Bullish Percentage - weak, lower high, below 70.
Percent of Stocks above MA50 - lower highs, below 75.
Fear Indicator VIX - moving lower, again half a point shy of 17.5 - to hit the long term trend line.
Advance-Decline Issues - heading lower.
HURST CYCLES
Short term cycles - close to the next 20d high at week 8 so this should be 10w high. After that decline for 2-3 weeks should follow for 10w low.

Week 15 for the 20w cycle. It is not clear what is going on with 20w cycle low - we have 5 weeks higher when we should see a decline, it is unusuall but sharp decline for 2-3 weeks could do the job completing flat correction.
The most obvious 18m low is in October, alternate 18m low in June.