Jul 11, 2011
Short term update
The indexes should not print such huge red bars at this stage... if they do not turn up and rally NOW than they are topping and we are at the begging of a multi month intermediate term down move with target the July 2010 lows.
Jul 9, 2011
Weekly review / Седмичен преглед
Nothing surprising this week. SP500 broke the resistance level 1345 just to trap more traders and the pullback began.
NYSE McClellan Oscillator told us the truth:) as I was expecting last week.
Longterm has not changed. I expect marginal new highs between 1380-1400.
Short-term 1-2 days sideway/up move to reset the histogram on the hourly chart, followed by another move down to finish the correction. Target is 1320-1325 where we have cluster of support - 38,2% retracement, the same size 35 reaction like the first one, support level and the trend line. If the bulls are strong the correction can find support at 1330 - another support level and EMA50.
Anyway watch the histogram to make a higher trough low and MACD to touch the zero line. At that point the correction will be over. The next move UP should be twice the size of the correction or at least 70 points and target the 1390 level.
The red line pointing down remember us to watch us for danger. If the next move up does not take out the last high 1356 or SP500 slice through 1320 like hot knife through butter than something else is going on.
P.S. The next three weeks I can not update the charts, I will travel across Bulgaria. If the bullish scenario play out and there is no surprises, it will last 3-4 weeks at least, so there will no be much to be updated.

Jul 3, 2011
Weekly review / Седмичен преглед
I was expecting a bounce but not such explosion:) I have read in some blog that there is 8 such rallies in SP500 history, I am sure, I can count them on my fingers.I do not have statistical data but I have charts showing similar rallies (see the charts bellow).
A lot of emotion in blogosphere... bulls laughing at bears (the opposite two weeks ago), bears trying to find bearish setups....
I say - You should trade what You see and not what You want to see. The indicators are pointing up, market breadth indicators have turned up so the market is moving higher until it says something different. Practical technical analysis not emotional technical analysis:)
So after this "explosion" I am returning to my initial idea of marginal new highs 1380-1400. The alternate scenario and in the same time low probability is that the sell off will resume.

Expect pullback followed by the next wave up. Why pullback? - see here
The pullback should be shallow and stay above the support zone 1315-1320 (if the bulls are so strong as they pretend).
P.S. we will have a pullback and at least a test of the last high. If it fails watch out for the alternate scenario
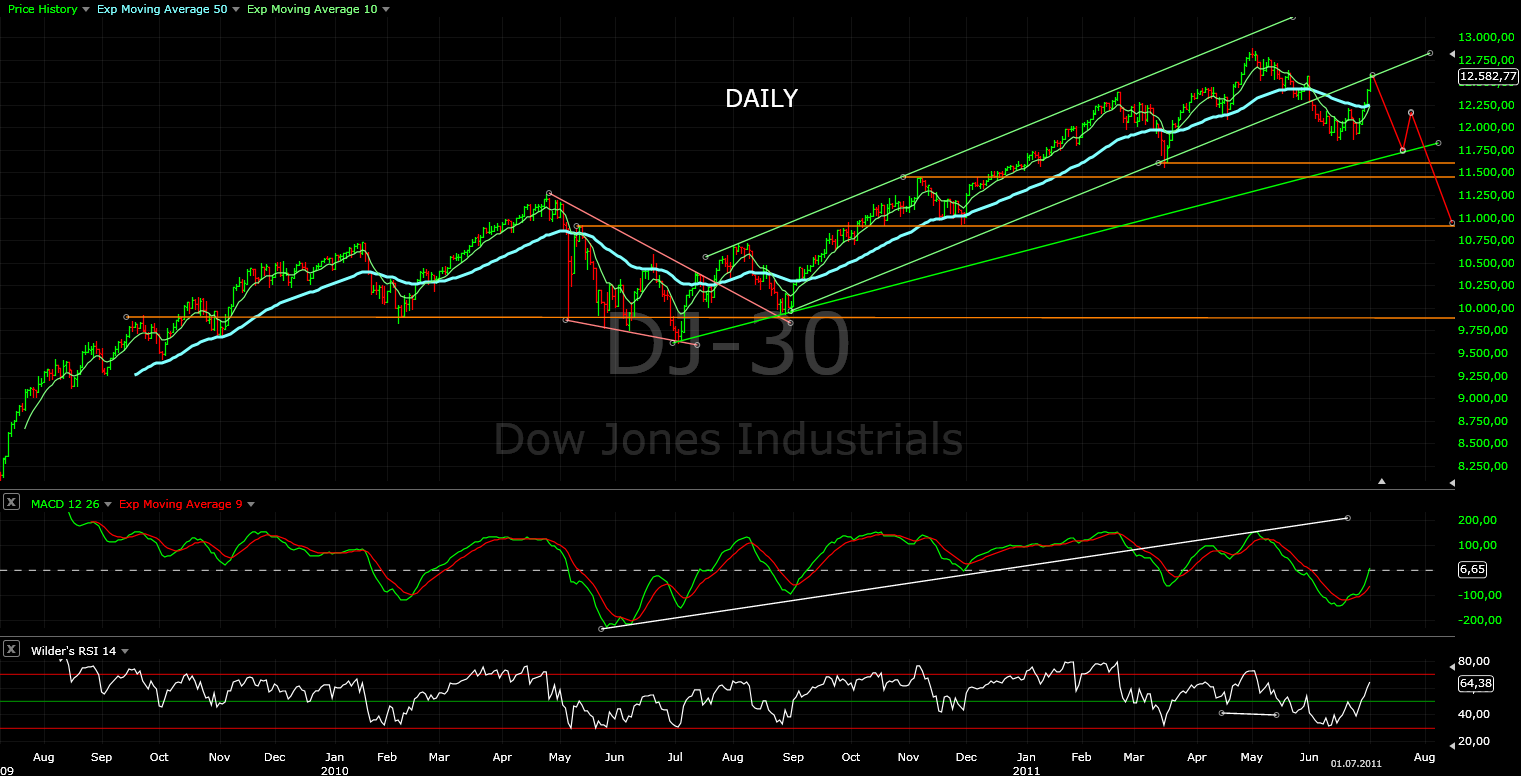
The bears say this is just a back test and "kiss of death". The trend line is broken and retested. You will see the same picture with trend line from the March 2009 bottom and logarithmic scale. On arithmetic scale the indexes just bounced from the trend line.
Two charts with similar rallies from the current cyclical bull market. What I see - if history repeats expect two days pause followed by another move 40-50 points higher.
The problem is that in March and July 2009 the bull market was very young and was rallying from very low and oversold levels, but I think there will be enough power for marginal new highs:)


The bears see this chart - the 2007 top and they think we are here (not hear:). Anyway if we get huge red bars covering the last 2-3 up candles they will be right. Look at the chart to see what to expect.

Why only marginal new highs and not major leg up like after July 2099 and 2010?
The market moves between fear and greed and the market players are fearless. Look at the VXO the fear gauge. Every correction since March 2009 drove the VXO to ~28. Look at this correction - 22. Even in November 2010 we had VXO at 23 after the shallow 3% percent correction. And from which levels begun the major rally last two times - July 2009 VXO at 31 and July 2010 VXO at 33.
I think we will not see major up leg because everybody are fearless and expecting, that this the begging of a huge rally to 1600(SP500) till year end.
P.S. If I am wrong, I am on the right side of the trade so who cares:)

A lot of emotion in blogosphere... bulls laughing at bears (the opposite two weeks ago), bears trying to find bearish setups....
I say - You should trade what You see and not what You want to see. The indicators are pointing up, market breadth indicators have turned up so the market is moving higher until it says something different. Practical technical analysis not emotional technical analysis:)
So after this "explosion" I am returning to my initial idea of marginal new highs 1380-1400. The alternate scenario and in the same time low probability is that the sell off will resume.

Expect pullback followed by the next wave up. Why pullback? - see here

The pullback should be shallow and stay above the support zone 1315-1320 (if the bulls are so strong as they pretend).
P.S. we will have a pullback and at least a test of the last high. If it fails watch out for the alternate scenario

The bears say this is just a back test and "kiss of death". The trend line is broken and retested. You will see the same picture with trend line from the March 2009 bottom and logarithmic scale. On arithmetic scale the indexes just bounced from the trend line.
Two charts with similar rallies from the current cyclical bull market. What I see - if history repeats expect two days pause followed by another move 40-50 points higher.
The problem is that in March and July 2009 the bull market was very young and was rallying from very low and oversold levels, but I think there will be enough power for marginal new highs:)


The bears see this chart - the 2007 top and they think we are here (not hear:). Anyway if we get huge red bars covering the last 2-3 up candles they will be right. Look at the chart to see what to expect.

Why only marginal new highs and not major leg up like after July 2099 and 2010?
The market moves between fear and greed and the market players are fearless. Look at the VXO the fear gauge. Every correction since March 2009 drove the VXO to ~28. Look at this correction - 22. Even in November 2010 we had VXO at 23 after the shallow 3% percent correction. And from which levels begun the major rally last two times - July 2009 VXO at 31 and July 2010 VXO at 33.
I think we will not see major up leg because everybody are fearless and expecting, that this the begging of a huge rally to 1600(SP500) till year end.
P.S. If I am wrong, I am on the right side of the trade so who cares:)

Subscribe to:
Posts (Atom)