Nov 28, 2020

Weekly preview

Nothing much new to say. Short term one strong day for more confusion if the final move up is already running or not. Cycles and indicators will look better if the pullback is not complete so I think 2-3 days lower before the final push higher will look better.

The interesting development is that in the last 3 months the indices gone nowhere, but we have euphoria trough the roof like late 2019-2020 Fear&Greed reached 92 in the last few weeks. This is a sign that we are close to a top. The usual behavior is top->correction->another top with Fear&Greed divergence - this is the perfect outcome in sync with pattern and cycles which I am showing.


TRADING
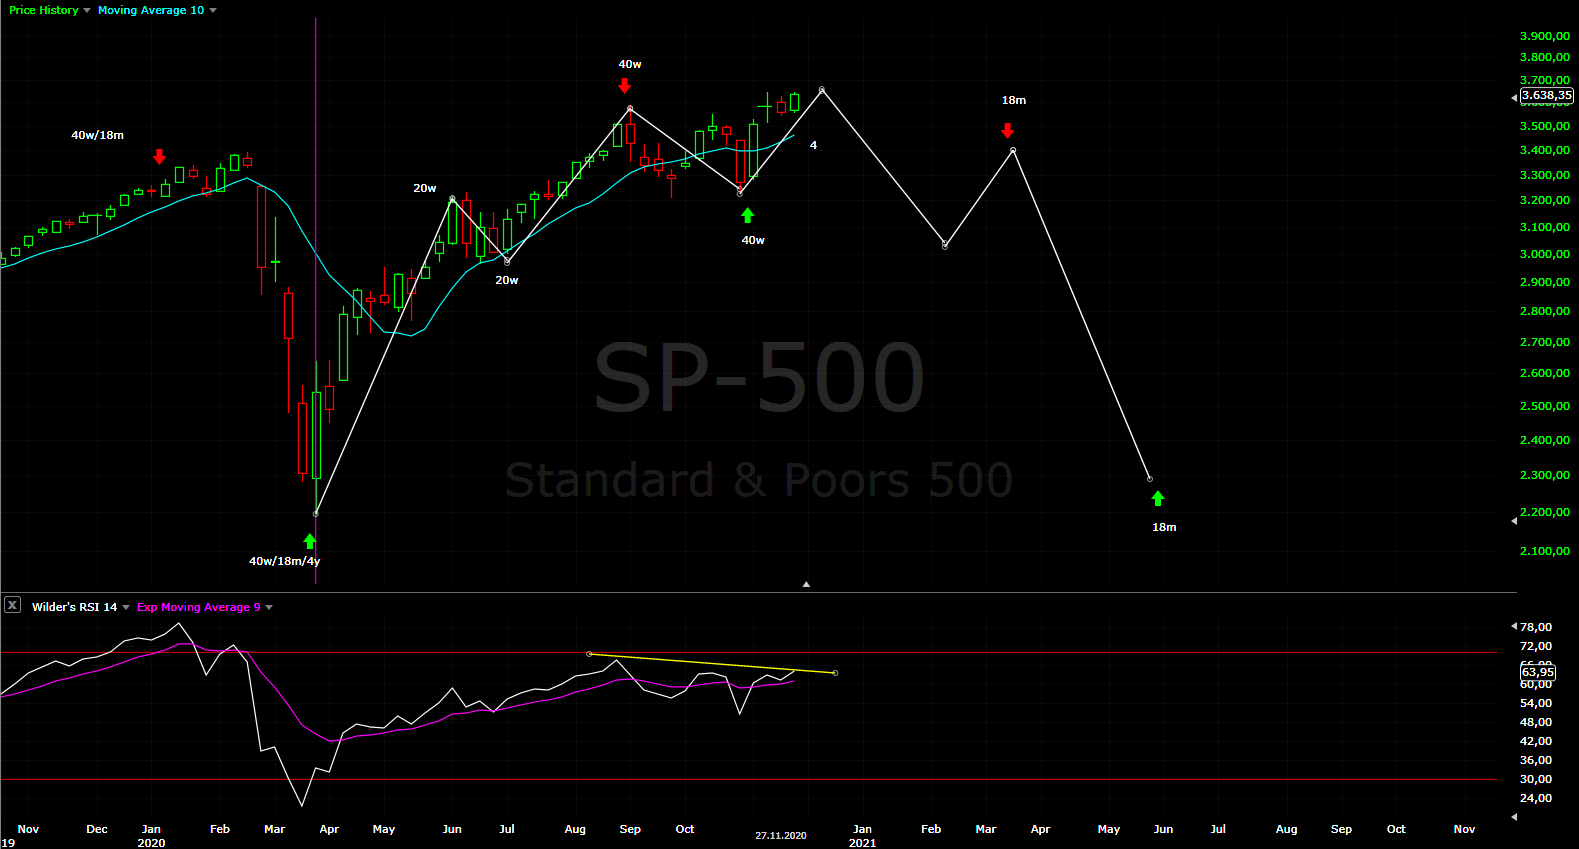
Trading cycle - buy signal. I have changed the counts, as I have explained last week they do not make sense any more. The low-to-low count one longer and one shorter daily cycle with average 2x45 days which is the usual average and this is in sync with the cycle model - 4 daily cycles for one 40w cycle.
The high-to-high count is way too long so with high probability we have two daily cycles from the high in September. The second one needs something like two weeks for a high which is in sync with the cycle model too.
The perfect outcome will be a few days lower for half cycle low and push higher to complete high-to-high daily cycle.


TECHNICAL PICTURE and ELLIOTT WAVES
Short term - either b is completed as a triangle and c running or one more leg lower to complete b as a flat. It is difficult to say... if you look at other indices like NYSE/RUT the first option looks better, when I look at cycles the second option looks better.


Intermediate term - nothing new. The indicators with divergences warning for a high. The pattern which fits best is symmetrical completing at 18m high.
Alternate the pattern completes at the current high g/Z. The difference will be the speed of the decline, which will follow.


Long term - the bull market completed in 2018. Since then a bunch of corrective waves. Currently I think this rally should be a corrective wave of a bigger pattern most likely triangle. Look at NDX we have corrective wave which is 1,618 bigger than the previous one which could be only b of a triangle. I think the best looking pattern is Neely's triangle. The indices are close to price high and turn lower. The indicators are pointing to topping not continuation. The weekly candles telling the same no continuation after the big green candle.


MARKET BREADTH INDICATORS
Market Breadth Indicators - do not follow higher. I think they are preparing for short term divergences, we have long term divergences already. In the mean time there is a lot of euphoria Fear&Greed reached 92.
McClellan Oscillator - pullback from the high.
McClellan Summation Index - buy signal.
Weekly Stochastic of the Summation Index - buy signal.
Bullish Percentage - pullback from the high.
Percent of Stocks above MA50 - pullback from the high.
Fear Indicator VIX - testing the previous low.
Advance-Decline Issues - pullback from the high.


HURST CYCLES
Short term cycles - we have 20d low either at day 9 or 15 and now hitting 20d high next should be 20d/5w low.


Week 4 for the 20w cycle. This is the cycle model I have shown last week. It makes most sense and I will follow this one until I see it is wrong.

Nov 21, 2020

Weekly preview

Deja vu another vaccine pop and pullback. What changed is that this pullback is taking too long, which pushes the top later in time. The implications are for the cycle count - the high-to-high cycles are much shorter, such long 40w cycle high is not very likely.

I expect the pullback to continue next week. I think the indices are heading lower into 5w low followed by 20w high first half of December. The alternate scenario is the top is in.... this will be very strange - roughly 5 days up and 10 days reversal which reversed nothing so far.


TRADING
Trading cycle - technically switched to sell signal with another cross. I would say just weaker move up.
The high-to-high is getting too long again, low-to-low says we are close to a low. Both high and low expected - complete nonsense. We have to look at the other tools. I would say look at the new cycle model for the right answer.


TECHNICAL PICTURE and ELLIOTT WAVES
Short term - still in the b wave. I think we will see more before it is complete.


Intermediate term - nothing new. The indicators with divergences warning for a high. The pattern which fits best is symmetrical completing at 18m high.
What will be the difference between "this is the top" and the pattern is not completed even if lower high follows? - The speed of the decline. In the case of a top the decline will be fast. In the case of wave h(red) it can retrace a lot like all the way down to 3000, but it will move slowly like 2 months.

For those interested in Neowaves:
In a NEoWave Diametric, the time and complexity exhibited by each wave will be very similar, but they remain different in price. This creates the contracting and expanding shape.
In a NEoWave Symmetrical, most waves possess the same time, price coverage and complexity. So far we have 4 surges higher with the same complexity, size and time. The only exception is wave e which is longer in time. I suppose that is why Neely switched to symmetrical, because it describes better the price action.


Long term - the bull market completed in 2018. Since then a bunch of corrective waves. Currently I think this rally should be a corrective wave of a bigger pattern most likely triangle. Look at NDX we have corrective wave which is 1,618 bigger than the previous one which could be only b of a triangle. I think the best looking pattern is Neely's triangle. The indices are close to price high and turn lower. The indicators are pointing to topping not continuation. The weekly candles telling the same no continuation after the big green candle.


MARKET BREADTH INDICATORS
Market Breadth Indicators - pulling back from overbought levels. I would say preparing for short term divergences and we have already long term divergences.
McClellan Oscillator - lower from the top.
McClellan Summation Index - buy signal with long term divergence.
Weekly Stochastic of the Summation Index - buy signal with multiple divergences.
Bullish Percentage - lower from the high.
Percent of Stocks above MA50 - lower from the high.
Fear Indicator VIX - doing nothing.
Advance-Decline Issues - lower from the high.


HURST CYCLES
Short term cycles - adjusted to the new long term count lets see if it will play out next week.
With this model we should see the decline continuing next week for 5w low followed by move higher for 5w/10w/20w high.


Why suggesting a new cycle model - because this 40w cycle high is getting too long. From the top in 2000 the 54m cycle(highs) is running roughly one year shorter 3,5 instead of 4,5 years. The 40w cycle is roughly 7 months long instead of 9 months.... and now should be 10 months long?!?!? - I doubt it. On top of this the down part(40w low) was 2-3 months shorter than the usual, I would expect shorter cycle not extended one. Why the important high B wave and low C wave should be at 40w high/low followed by 18m high/low in the middle of nowhere it does not make much sense.

It is the same pattern and shape, the difference is the summation of three cycles causing this shape are not 10w/20w/40w but 20w/40w/80w. The key difference and confirmation - the initial decline will take longer like two months. Now waiting and watching what happens in the coming weeks.
All that this count has and the previous one has not:
- the sequence 20w/40w high -> 20w/40w low runs smoothly as it should be.
- the 40w high-to-high is running shorter as it should be.
- the important highs/lows are at 18m highs/lows at pattern highs/lows as it should be.

Nov 14, 2020

Weekly preview

Pullback as expected, but first we saw spectacular one day blow off most of it retraced the same day. The pattern is taking shape, the cycles are getting mature so the indices are nearing important high - 40w high and the top for the move from the March low. I would say another week or two.


TRADING
Trading cycle - buy signal. The high-to-high cycle is mature for a top and waiting when it will reverse for the real down part of the fourth daily cycle... maybe test of MA10 next week and final high.


TECHNICAL PICTURE and ELLIOTT WAVES
Short term - from the March low all moves are zig-zags... that is why I want to see final c wave and another zig-zag for completed pattern. For perfect alternation of the zig-zags in the Z pattern we should see c=0,618xa. It looks like a flat for b/b, on Monday we will have more clarity alternate c/Z is already running.


Intermediate term - zig-zags building bigger zig-zags, there is no impulses. From orthodox EW perspective is triple combination W-X-Y-X-Z, but there is no impulses. So if you stick strictly to the theory you need something else like neowaves patterns diametric/symmetrical. According comments G.Neely sees symmetrical with lower high for i(red count) - example. I will not be surprised, it will fit perfect:
- from TA perspective it is complex H&S top and we will see the price playing around with the MAs before the real decline.
- from cycle perspective it is this wobble caused by the coming 10w low(see weekly cycle chart).
- it will burn time which is necessary - if we see the big decline starting now it will take too long until March and fear does not take so long to discharge.
MACD shows clear double divergence between the three highs - just an info for those who dream that this is continuation.


Long term - the bull market completed in 2018. Since then a bunch of corrective waves. Currently I think this rally should be a corrective wave of a bigger pattern most likely triangle. Look at NDX we have corrective wave which is 1,618 bigger than the previous one which could be only b of a triangle. I think the best looking pattern is Neely's triangle.
The indices are close to price high and turn lower. The indicators are pointing to topping not continuation. The weekly candle telling the same no continuation after the big green candle from last week.


MARKET BREADTH INDICATORS
Market Breadth Indicators - overbought some with divergences, it will be perfect if we see the oscillators with short term divergences too.
McClellan Oscillator - lower highs.
McClellan Summation Index - buy signal with divergences.
Weekly Stochastic of the Summation Index - sell signal.
Bullish Percentage - overbought level.
Percent of Stocks above MA50 - overbought level.
Fear Indicator VIX - higher low.
Advance-Decline Issues - overbought, lower high and divergence.


HURST CYCLES
Short term cycles - the last three 5w cycles are counting better if you dived them in three not two. I see 10+10+8=28 5w high, 8+9+9=26 5w low and so far 9+11+4=24 for 5w high. So we should see a low soon and a few days higher to complete at least 5w/10w high and with high probability 40w high.


Week 7 for the 20w cycle. The indices are close to 40w cycle high.

Nov 7, 2020

Weekly preview

Short term low as expected and sharp rally. The goal for this final move was to kill the bears and convince the bulls that there is only one direction and it did it perfect.... the market is so strong:)))))))
Why I do not think it is strong - because it is corrective, market breadth does not really support it, all 4 candles with shadows. Exhaustion gaps and distribution - push the futures it is cheap and sell during the opening hours. This is not how strong move looks like.

Now we wait for completed pattern - triangle/zig-zag, or if it somehow develops as impulse(less likely).


TRADING
Trading cycle - another flip to buy signal this time. We have 4 flips within two months. The reason is we have a sideways pattern running. Now the high-to-high cycle is mature for a top and waiting when it will reverse for the real down part of the fourth daily cycle.
The analysis and trigger should point to the same outcome. When they diverge is wait to see, which one is right - the analysis or the trigger. I bet that the analysis is right(no reversal) and it is playing out. Sideways patterns triangles and flats are the "wekaness" of this trigger.


TECHNICAL PICTURE and ELLIOTT WAVES
Short term - so far corrective move. We have two legs up with the same size very well visible on the futures with the big decline in the middle. On the cash index the hint is this perfect channeling which occurs in corrective structures. It is less likely to mutate into impulse more likely expect some kind of a pullback next week. Any pullback above 50% is b wave. 62% pullback or more and we have triangle.


Intermediate term - with another corrective move there is many combinations. I am showing those who will complete the pattern - g/Z triangle(yellow) or g(red).


Long term - the bull market completed in 2018. Since then a bunch of corrective waves. Currently I think this rally should be a corrective wave of a bigger pattern most likely triangle. Look at NDX we have corrective wave which is 1,618 bigger than the previous one which could be only b of a triangle. I think the best looking pattern is Neely's triangle. Wave C should begin soon.


MARKET BREADTH INDICATORS
Market Breadth Indicators - oscillators are resetting, but I do not see strong reversal to support this move up.
McClellan Oscillator - lower high.
McClellan Summation Index - trying to turn up.
Weekly Stochastic of the Summation Index - sell signal.
Bullish Percentage - turned up.
Percent of Stocks above MA50 - another lower high so far.
Fear Indicator VIX - in a range too, higher low so far.
Advance-Decline Issues - weak around the middle of the range.


HURST CYCLES
Short term cycles - 5w low and now heading into 5w/10w high. I am speculating that we will see similar 5w cycles for the 10w cycle high. This means symmetrical 20d cycle 9+9=18 leading to two identical 5w cycles 10+18 and 9+18 - short said up to another 8 trading days before we see the high.
Comparing them the index is at 9-10 day high(the circles) and now a few days pullback is expected followed by final move up for 3-4 days.
History rhymes it does not repeat and with the waves it is the same they alternate. What I mean in the previous 5w cycle the pullback was 4 days sideways move and this time it could be deeper pullback. For example the previous up leg from 24.09 was - weaker move up, sideways pullback, strong 4 days up with gaps. The current up leg is already alternating - strong 4 days up with gaps, pullback maybe bigger this time to alternate and what left is the weaker final move up.


Week 6 for the 20w cycle. For now sticking to the plan that late September was 20w low and we have not seen the 40w high.