Oct 29, 2016

Weekly preview

Short term view - we should see a move lower in the first week of November.
Intermediate term view - waiting for a bottom followed by a rally in November.

Another very choppy week.... again nothing interesting and waste of time, but I have one idea which looks good.

In the comments I was asked if wave lower is already running. For a few weeks I think that we have stealth 40 week cycle low in September (the 50 points plunge) and wave 2 lower is running. Why? - First overlapping waves, for DJ we have already overlapping between supposed wave 1 and 4. Second because of cycles - since the 2009 low I have not seen two longer 20 week cycles in a row in one 40 week cycle. Usually you have one longer and one shorter cycle and you have 40 week cycle with average size.
The problem is that the move lower definitely consists of corrective waves. You do not need to be expert to see the mess we have.

I was thinking about diagonal lower, but the second low was just slightly lower with a long shadow.... I thought maybe a triangle. Than again in comments someone pointed out that descending triangle is a bearish pattern and I have looked yesterday NYSE chart... now I think the "triangle" is in fact diagonal (see the NYSE chart).

The alternate scenario is because of the "political drama" in the US, the market becomes nervous and we see a spike lower to cause fear before a bottom.


TECHNICAL PICTURE and ELLIOTT WAVES
Short term - closer look of the patterns. The more bearish pattern (red zig-zag) does not count very good and does not make sense. It is bullish (bull flag), but it will overlap with the previous wave higher which is bearish.... where is the impulse and the bullish pattern????
Short term it is difficult to say if the indexes will continue lower and make a low on Wednesday(FOMC) or bounce higher(FOMC) and make a low around the elections. With the rally from the low on Friday the second option looks better.


Intermediate term - I would like to see the wedge to overshoot a little bit and overlap with the top of the first wave higher at 2110. This will confirm that the wave higher is finished.


Long term - RSI looks to support the idea that a wave lower is already running.... worst case slightly higher high with divergence.


MARKET BREADTH INDICATORS
The Market Breadth Indicators - the message I see is that we are nearing a bottom.
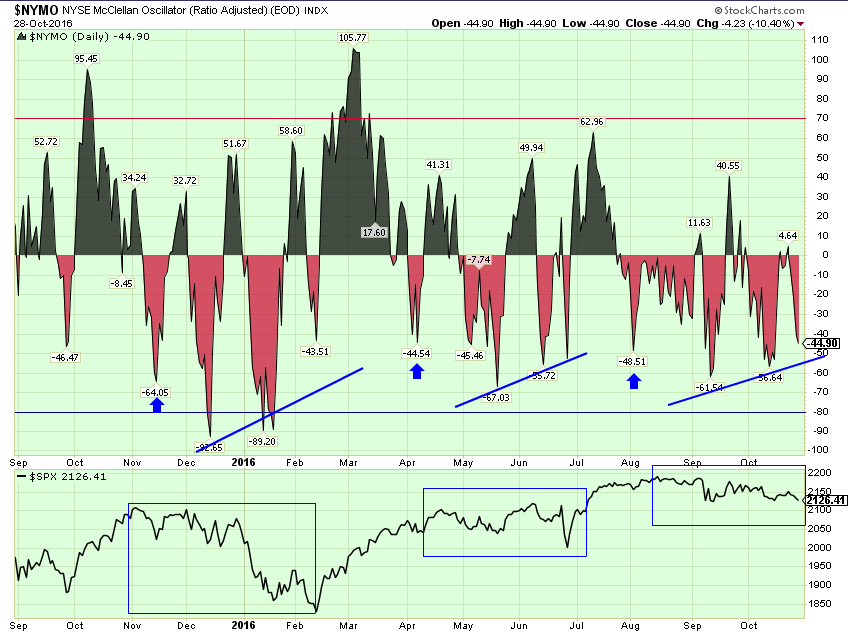
McClellan Oscillator - multiple divergences.
McClellan Summation Index - sell signal, nearing zero.
Weekly Stochastic of the Summation Index - sell signal, oversold levels for weeks.
Bullish Percentage - sell signal, close to a level where a correction bottoms.
Percent of Stocks above MA50 - slightly above the oversold level, ready for a divergence?
Fear Indicator VIX - some fear and level like 20 will be good for a low. I think it has started building divergences for an intermediate term top.
Advance-Decline Issues - in the middle of the range.


HURST CYCLES
You can see that from the 2009 bottom there is no single 40 week cycle consisting of long+long 20 week cycle (average is 14-16 weeks length). The pattern is usually long+short(something like 19+12 weeks) or long+average(20+14) or average+average(14+16). You need shorter cycle because the length of the 9 year cycle is 7 years.
That is why I think we have stealth 40 week cycle low in September and this is the first 40 day cycle of the next 20/40 week cycle.
Now we wait for a confirmation - a rally making lower high.


NYSE - it looks like clear pattern to me.... diagonal lower.


McClellan Oscillator - compare with the previous corrections. The indicator is spending several months in the red area(below zero), the first trough (the arrow) says correction is around the corner, than we have another three troughs with divergence.
It will be very very unusual if the move lower just continue for another month or two without a retracement first and reset of the indicators from oversold levels.

Oct 22, 2016

Weekly preview

Short term view - more likely lower, the indexes are not finished to the downside.
Intermediate term view - waiting for the bottom of the move lower than we should see a rally.

The markets are waiting.... doing nothing. Probably the bottom will be around the US election which will be the catalyst for a rally. Usually when the markets are pushed lower expect move higher after the news/event.

The same like last week - two possible patterns triangle or zig-zag, nothing to suggest a bottom, the price is struggling for 8 days with resistance around 2145 and now MA20... not very bullish.


TECHNICAL PICTURE and ELLIOTT WAVES
Short term - I have not watch the charts this week, it is waste of time... just waiting. The two patterns are shown on the chart triangle yellow and bull flag(zig-zag red).


Intermediate term - the same shown on the daily chart. No signs of a bottom, no signs that this is something more than a corrective move. So waiting fo a bottom followed by a rally.
If the price manage to move above resistance and MA20 we will have a triangle if it fails I expect to see a bull flag.


Long term - the indicators do not look pretty and this should be the last move higher before 18 month cycle top and a bigger correction lower.


MARKET BREADTH INDICATORS
The Market Breadth Indicators - the same like last week mature correction, but no signs of a bottom.
McClellan Oscillator - expect to see one more trough with divergences.
McClellan Summation Index - sell signal.
Weekly Stochastic of the Summation Index - sell signal, in oversold territory for a while.
Bullish Percentage - sell signal.
Percent of Stocks above MA50 - close to oversold level one final spike below it will look great.
Fear Indicator VIX - some fear and level like 20 will be good for a low. I think it has started building divergences for an intermediate term top.
Advance-Decline Issues - in the middle of the range.


HURST CYCLES
Another two weeks will finish 40 day cycle.

It will look better if we see 40 week cycle with the low for this correction... but unusually long. Not so important we will adjust the count later if necessary.


TNA as a proxy for RUT - the same like last week. It looks like consolidation before a last move lower to finish an impulse from a flat correction. Watch for a divergence.

Oct 15, 2016

Weekly preview

Short term view - more likely lower, the indexes are not finished to the downside.
Intermediate term view - we have correction for two months which is not finished it will last a few more weeks.

We have the spike lower. It is not a surprise, I wrote for two weeks about the bearish price action around MA50.It is typical price behavior.
Than in the comments I was speculating about short term bottom in a day or two. Why? Because the whole structure from the top looks corrective. Now we have the move higher and "surprise" it is another a-b-c which hit resistance around 2145 and MA50 on the hourly chart.

Short term forecasts look ok... which does not help us with the big picture. We have more and more corrective waves and more combinations....
What we know - we have a move lower for two months already, which looks corrective. I do not see an impulse lower to suggest acceleration lower. I do not see fear and finished pattern to suggest that a low is in place. Market breadth is correcting and the indexes should be heading for a bottom, but not quite there yet. It could last a few weeks before a bottom.
Most likely the correction will continue for a few weeks.... the pattern I am not sure what pattern we have.


TECHNICAL PICTURE and ELLIOTT WAVES
Short term - move lower and corrective reversal so far which hit resistance. If we see a continuation higher a move with the same size will hit the trend line and the pattern will look like triangle(yellow)- If we see continuation lower the whole pattern will look like huge zig-zag A-B-C (red).... now just waiting.


Intermediate term - waiting to see what pattern we have and to pinpoint the 40 week cycle low. The indexes should "attack" the ATH one more time before a move lower for a few months.


Long term - no change.


MARKET BREADTH INDICATORS
The Market Breadth Indicators - are showing mature correction, but no signs of a bottom. It could last a few weeks before we see reversal.
McClellan Oscillator - spending the last two months below zero. We have two troughs already with divergence.. I think we will see one more trough before a bottom.
McClellan Summation Index - sell signal.
Weekly Stochastic of the Summation Index - sell signal, in oversold territory for a while
Bullish Percentage - sell signal.
Percent of Stocks above MA50 - close to oversold level one final spike below it will look great.
Fear Indicator VIX - some fear and level like 20 will be good for a low. I think it has started building divergences for an intermediate term top.
Advance-Decline Issues - nearing the oversold level.


HURST CYCLES
Not very clear like EW, there is room for interpretation... so just waiting.


Russell2000 and Nasdaq look different. It is possible to count an impulse for a flat correction. The chart is from Thurday and we have a move higher for 4 so it works so far. You want to see MACD and RSI close to the trend lines and than making higher low when the indexes are making lower low.


I have posted this chart early July stating not to expect strong rally based on the historical behavior of the indicator.

As expected we saw second peek, the indicator is heading lower and the indexes are correcting for more than two months.
So far there is no signs for a low. If this is some kind of wave 4 we should see the indicator around zero when the indexes are making low.
If it is something more bearish it will move lower to the -400 -600 area.

Oct 11, 2016

Update

I thought with the 50 points plunge in September the market is out of the coma:).... no it just got worse.
Without doubt this is the choppiest and the ugliest pattern I have ever seen lasting so long.

We have one month of triangles with 2-3 sharp but short living moves up and down. Yesterday we saw another candle with long shadow touching the trend line and closing below MA50... not really bullish.
I still think that we are in some corrective structure. This "B" wave is stretching and stretching and stretching... first it looked like zig-zag than like triangle and now like zig-zag with triangle in the middle section(white count).
If we see higher prices probably B of higher degree(red count).... I have to be very creative to see an impulse and to expect new ATH with this mess.

Oct 9, 2016

Update

Nothing happened this week. If you read the last post it is the same... no need even to update the charts. I expect move lower before we can think of a bottom.

The move is corrective and choppy, looks like a triangle. The down trend is in tact, the price action develops below the MA50 on the daily chart. I can not imagine this to be the start of a move higher... first we should see some spike lower and fear before any reversal higher. The only change - because the move continues for too long the scenario with lower low looks more probable now.


DJIA hourly chart the pattern is more clear. It looks like triangle for wave B. It is too long for small wave b of 2 so the scenario with lower low has higher probability.


The price is struggling with MA50 which is bearish. Last week the index managed to move above it this week barely touch it. MACD looking weak, struggling with the zero line. RSI turning lower from the trend line. I see only weakness... we need a spike lower.

Oct 1, 2016

Weekly preview

Short term view - one more wave lower to around 2135-2140 and than the ATH should be tested.
Intermediate term view - a few more weeks higher after that the 40 week and 18 month cycles should turn lower.

What we knew last week - we have corrective waves and not to expect a rally higher... the pattern not clear. We saw very choppy week with sharp moves higher and lower confirming that we have corrective structure.... the pattern still ambiguous.

In the last post I have shown one bullish pattern ED and one bearish zig-zag... despite other possible patterns I still think this two make most sense.
The news about DB altered the short term waves, but not the pattern. The difference is now SP500 looks better with ED and the DAX with 7 waves lower we have possible finished double zig-zag followed by strong impulsive rally.
On the other side DJ will look better with lower low and if you look at the RSI trend line and MA50 on the daily chart you will see that the down trend is still in tact, the indexes are struggling to close above MA50 without success which is bearish.

Tough choice:) I favor the ED at the moment.... in fact we do not need to choose. Analyzing and trading are two different animals. Looking through the eyes of a trader - if we see five waves lower to around 2135 for c=a of 2 of ED and reversal you enter long position and you know where the stop is. If it is the bearish scenario the price should move through this level without hesitation and stop 5-10 points below the last low 2119.


TECHNICAL PICTURE and ELLIOTT WAVES
Short term - despite the impressive rally it still looks like corrective wave b(or ii for the bearish scenario). Next target is c=a around 2135-2140 to finish wave 2 of an ED.
If we see the price moving through this area than we are watching the bearish scenario with target around 2110.


Intermediate term - the down trend is still in tact. The price is struggling with MA50 and RSI do not have enough inertia to break above the trend line. Waiting to see which pattern will play out. ED has slightly higher chances, but we will see.


Long term - no change. I think this is wave 1 of the final move higher for this bull market.


MARKET BREADTH INDICATORS
The Market Breadth Indicators - look like want to move higher for one more divergence before a bigger move lower, no strong sell or buy signal.
McClellan Oscillator - oscillate around the zero line.
McClellan Summation Index - probably it will move higher for a divergence.
Weekly Stochastic of the Summation Index - turned up from oversold level buy signal.
Bullish Percentage - still above 70 no signs of sell signal.
Percent of Stocks above MA50 - in middle of the range.
Fear Indicator VIX - complacency we should see divergences in the next weeks.
Advance-Decline Issues - heading higher expect divergence.


HURST CYCLES
We are in the time window for 40 week cycle low just waiting to pinpoint the low at week 11 or week 15-16. With three green weeks in a row the probability is higher that it is behind us (ED is running).


Tom Demark SEQUENTIAL AND COUNTDOWN - this technique spots areas of exhaustion.
Waiting for a close above bar 8 of the countdown than we will have finished countdown on the weekly chart.


The two options for RUT with TNA as a proxy.


DAX - we saw one more lower low and now the short term and long term pattern synchronizes perfect with the US indexes.