
Apr 25, 2013
Vacation
I am on a vacation for two weeks and I won't be able to post weekly updates in the next 3 weekends. I will post some thoughts when I have time.
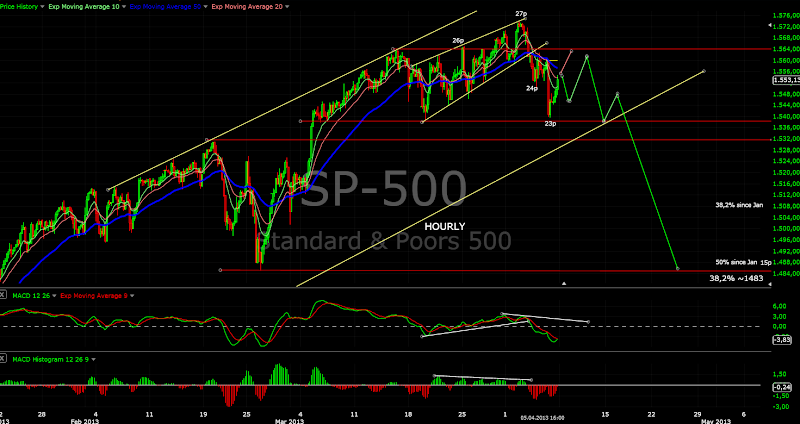
Short term the bullish scenario is playing out - see the hourly chart from the previous post. Until the 1565-1570 area holds the short term view stays bullish. This is the line in sand currently.
Intermediate term I think we will see a correction in May.
UPDATE after the close - the current daily chart. SP500 looks very strong and reached its upper trend line..... BUT DJ was a leader all the time and now it looks very very week. Only one strong day for 5 days "rally" - DJ is just testing its broken trend line. The VIX is making third higher low and is green the last two days. I will be very careful with longs. Look at the top in May 2012 - it looks similar and I am sure 90% were waiting for new highs and the result was 10% drop.
If the indexes will move higher we should NOT see more than one or two red days and 1565-1570 area should hold (btw all pauses in the trend since November are with size 23-25 points 1592-25=1567 - the middle of the support range.)
Again with or without new high the next move should be a corretion for several weeks.

Apr 24, 2013
Short term update
It still could be a lower high but we should see red day tomorrow and the trend line and support should be busted in the next day or two. If this does not happen the overbought conditions will be worked out and we will see something like on the chart bellow.
Even if we see new highs I do not think that the bigger picture will change and the next bigger move should be lower. Why? Because the momentum on the weekly charts points lower, MACD daily chart divergence, market breadth indicators divergences.


Apr 23, 2013
Short term update
UPDATE: End of the day - this mini flash crash has even broke the trend line on the chart bellow and the high is being tested. At this point this "crash" probably should be ignored, difficult to say. The last several moves reversed on no signs no divergence nothing... predictions are difficult. Short term the price on the hourly chart is too far from EMA50 and momentum is reversing. Two options pause for a day or two and up or reversal again. The bigger picture - I still think that the next bigger move will be lower. The problem is we can even see higher highs. Until than all bears will be killed and I will shoot my self... again:)
Multi day rebound, target reached as expected... soon will know if this is only a corrective move.
UPDATE: Noon - It does not look good for the bears at the moment... no weakness. If the direction is down we should see weakness in the afternoon session, something like on the chart. If the indexes just burn time moving sideways the direction is up again at least for this week.


Apr 22, 2013
Short term update
UPDATE: This was a little bit too early. I was expecting double top on the smaller time frames... The bulls have won the short term battle. Target A=C is 1569-1572. I will hold i do not think that this is a new rally
Short at 1559 and we will see what will happen.....
Apr 20, 2013
Weekly review
Short term view - multi day rebound expected.
Intermediate term view - intermediate term correction 3-6 weeks.
Trading system signal (swing trading) - Direction: DOWN | Last entry signal: at SP500=1560 on 15.04.2013 | Stop at:1591
I wrote last week that I want to see a top or something is wrong... a week later the cosmic order is restored and I am happy:))))) It is confirmed that the move up was an exhaustion and a trap. The call for a top was wrong only for one day and several points - pure luck:)
My expectations now are - short term rebound which should be the last opportunity for an entry at higher levels to ride the correction. Intermediate term - correction for 3-6 weeks time frame between mid May and the end of May. Target zone 1440-1470 - average correction size 8%->1469, support previous top ~1470, 50% Fibo retracement ~1470, trend line ~1450, MA200 ~1450, 61,8% Fibo 1440.
TECHNICAL PICTURE
Short term - support level reached, bullish candle on the daily chart, 3 waves lower not impulsive... I think we will see multi day rebound to resistance 1565-1575. We are talking about correction of the correction so be ready for surprises. Several points higher is the trend line and EMA50 and we should see a reaction to the downside which should stay above 1540 if wave B is playing out. If this level is broken again there is very high probability that the move lower has resumed.

- Triple cross(EMA10 and EMA20 crossing EMA50) - short term moving averages and price bellow EMA50. Short term direction is down.
Intermediate term - the trend line is broken but the price found support at MA50. Last week a wrote "the price will flirt for a while with the trend line and MA50" we are in this phase now. We have the expected topping process 5 weeks for now or 6 weeks with probable retest of 1575, everything as expected. After that, if you see the previous corrections, there will be no many stops on the way lower. My target - time frame and size is shown as a box on the chart.

- Trend direction EMA50/MACD - price is above EMA50 and MACD above zero so intermediate term trend up is not killed, but we have double MACD divergence and I think it is a matter of time this to happen. When the price break bellow EMA50 and MACD bellow zero beware of violent move lower.
- Momentum Histogram/RSI - momentum turned lower and RSI broke its trend line.
Long term - the idea stays the same expect correction but this is not a major top. DJIA RSI on the weekly chart made new record high 78 for the bull market. The Market does not top on strength but extremes are warning for a correction. This happened every time in the past when RSI reached such levels so I do not think that this time is different.

- Trend direction EMA50/MACD - MACD is above the zero line and the price above EMA50, the long term trend is UP. No divergences so I think that the cyclical bull is not over.
- Momentum Histogram/RSI - momentum turned lower and RSI broke its trend line - intermediate term trend is lower.
MARKET BREADTH INDICATORS
The Market Breadth Indicators - say we are in the middle of the correction. That is not a surprise the corrections usually develop in two phases - first phase choppy sideway/down move and the second phase strong move lower. We are near to the end of this first phase.
McClellan Oscillator - looks oversold. I will not be surprised to see several green days.
McClellan Summation Index - no change, we have a sell signal since mid March.
Weekly Stochastic of the Summation Index - already in oversold territory. The correction should not last very long.
Bullish Percentage - sell signal. I expect to see the usual range for a correction something between 40-60.
Percent of Stocks above MA50 - moving lower as expected. I expect the usual level for correction 25 to be hit before the end of the correction.
Fear Indicator VXO - short term divergence was a warning to expect a top. We have series of higher lows and higher highs. The Indicator started an uptrend which means the stocks should move lower.
Issues Advancing - not very impressed with the selling even made higher high.
Issues Declining - does no made higher high. The selling is obviously not broad based.
HURST CYCLES
In the middle of the 20 day cycle. It broke slightly bellow the low of the previous 20 day and 40 day cycle which is a sign that the cycle of higher degree the 20 week cycle has already topped out.

At week 8 of the current 20 week cycle. Average correction's duration is 15-30 trading days, which is 3-6 weeks, or cycle low between 11 and 14 weeks. That fits perfect.

Tom Demark SEQUENTIAL AND COUNTDOWN - this technique spots areas of exhaustion.
The combo counts left unfinished at 12... I do not think that there will be completed in the next several weeks.
The setup on the daily chart was aborted. The move lower has not enough strength for now. I expect only correction so that does not worry me.
We have a price flip which means momentum has reversed.

DAX chart for a friend - DAX respects the trend lines and the support/resistance levels. It is pretty oversold and should start multi day rebound. 50% Fibo retracement and the trend line point to ~7750. Than measured move lower or W=Y for a W-X-Y correction points to the next support level 7000-7100.
Intermediate term view - intermediate term correction 3-6 weeks.
Trading system signal (swing trading) - Direction: DOWN | Last entry signal: at SP500=1560 on 15.04.2013 | Stop at:1591
I wrote last week that I want to see a top or something is wrong... a week later the cosmic order is restored and I am happy:))))) It is confirmed that the move up was an exhaustion and a trap. The call for a top was wrong only for one day and several points - pure luck:)
My expectations now are - short term rebound which should be the last opportunity for an entry at higher levels to ride the correction. Intermediate term - correction for 3-6 weeks time frame between mid May and the end of May. Target zone 1440-1470 - average correction size 8%->1469, support previous top ~1470, 50% Fibo retracement ~1470, trend line ~1450, MA200 ~1450, 61,8% Fibo 1440.
TECHNICAL PICTURE
Short term - support level reached, bullish candle on the daily chart, 3 waves lower not impulsive... I think we will see multi day rebound to resistance 1565-1575. We are talking about correction of the correction so be ready for surprises. Several points higher is the trend line and EMA50 and we should see a reaction to the downside which should stay above 1540 if wave B is playing out. If this level is broken again there is very high probability that the move lower has resumed.

- Triple cross(EMA10 and EMA20 crossing EMA50) - short term moving averages and price bellow EMA50. Short term direction is down.
Intermediate term - the trend line is broken but the price found support at MA50. Last week a wrote "the price will flirt for a while with the trend line and MA50" we are in this phase now. We have the expected topping process 5 weeks for now or 6 weeks with probable retest of 1575, everything as expected. After that, if you see the previous corrections, there will be no many stops on the way lower. My target - time frame and size is shown as a box on the chart.

- Trend direction EMA50/MACD - price is above EMA50 and MACD above zero so intermediate term trend up is not killed, but we have double MACD divergence and I think it is a matter of time this to happen. When the price break bellow EMA50 and MACD bellow zero beware of violent move lower.
- Momentum Histogram/RSI - momentum turned lower and RSI broke its trend line.
Long term - the idea stays the same expect correction but this is not a major top. DJIA RSI on the weekly chart made new record high 78 for the bull market. The Market does not top on strength but extremes are warning for a correction. This happened every time in the past when RSI reached such levels so I do not think that this time is different.

- Trend direction EMA50/MACD - MACD is above the zero line and the price above EMA50, the long term trend is UP. No divergences so I think that the cyclical bull is not over.
- Momentum Histogram/RSI - momentum turned lower and RSI broke its trend line - intermediate term trend is lower.
MARKET BREADTH INDICATORS
The Market Breadth Indicators - say we are in the middle of the correction. That is not a surprise the corrections usually develop in two phases - first phase choppy sideway/down move and the second phase strong move lower. We are near to the end of this first phase.
McClellan Oscillator - looks oversold. I will not be surprised to see several green days.
McClellan Summation Index - no change, we have a sell signal since mid March.
Weekly Stochastic of the Summation Index - already in oversold territory. The correction should not last very long.
Bullish Percentage - sell signal. I expect to see the usual range for a correction something between 40-60.
Percent of Stocks above MA50 - moving lower as expected. I expect the usual level for correction 25 to be hit before the end of the correction.
Fear Indicator VXO - short term divergence was a warning to expect a top. We have series of higher lows and higher highs. The Indicator started an uptrend which means the stocks should move lower.
Issues Advancing - not very impressed with the selling even made higher high.
Issues Declining - does no made higher high. The selling is obviously not broad based.
HURST CYCLES
In the middle of the 20 day cycle. It broke slightly bellow the low of the previous 20 day and 40 day cycle which is a sign that the cycle of higher degree the 20 week cycle has already topped out.

At week 8 of the current 20 week cycle. Average correction's duration is 15-30 trading days, which is 3-6 weeks, or cycle low between 11 and 14 weeks. That fits perfect.

Tom Demark SEQUENTIAL AND COUNTDOWN - this technique spots areas of exhaustion.
The combo counts left unfinished at 12... I do not think that there will be completed in the next several weeks.
The setup on the daily chart was aborted. The move lower has not enough strength for now. I expect only correction so that does not worry me.

We have a price flip which means momentum has reversed.

DAX chart for a friend - DAX respects the trend lines and the support/resistance levels. It is pretty oversold and should start multi day rebound. 50% Fibo retracement and the trend line point to ~7750. Than measured move lower or W=Y for a W-X-Y correction points to the next support level 7000-7100.

Apr 17, 2013
Short term update
UPDATE: One more push lower for divergence on the smaller time frames as expected. I think it is time to take some profits.
What should I say? Here we go again:) The move yesterday stretched enough to the upside to hit my stop(for 1 point) and make me doubt. The system is anyway on sell and it is not a problem to re-short again today, not a drama. This market is day trader's paradise.
If you are a big bear I must disappoint you - the whole crazy action which we are seeing, burns too much energy to the downside. Technical and market breadth indicators say we are already in the middle of the correction and the price went nowhere. There will be one strong final move lower(which is typical for all corrections), but I do not see something more than normal correction 7%-8%. Possible targets - correction 8% 1469, support previous top 1470, 50% Fibo retracement 1470, trend line ~1450, MA200 ~1450, 61,8% Fibo 1440 - watch the area 1450-1470. Overall the bigger plan is being confirmed. Buy the way the price still has not broke the last minor support level ~1539 and EMA50 on the daily chart.
It is some odd expanding formation and SP500 is already in the fifth wave. The logical conclusion is to expect 3 waves up. The index is still above EMA50 and support 1539 so I think there will be one more move to 1575.


Apr 16, 2013
Short term update
Here we go again.... the same story about huge bars is valid for the down side too. The bar today retraced more than 50% of the previous day and closed at the high for the day. That is suspicious... Shorts closed. Short term - reversal after reversal, no divergences, no pullbacks... just up and down. I do not know about you, but I am getting very tired already.
One bullish scenario - the whole mess in the middle looks like perfect expanding flat X wave and we saw already A-B of Y and the last wave C up has begun today. Measures where A=C and W=Y point to something between 1610 and 1620. Until the trend line or the low at B around 1550 is broken it is worth to keep an eye on this scenario.


Apr 15, 2013
Short term update
UPDATE: It is a little bit to strong this move to be wave 4 it could be a-b-c and we saw wave a. If it will move lower now is the moment after retest of EMA50 on the hourly chart. Stop is now at 1574 1 point above the high till now.
UPDATE: short at 1569...
UPDATE: Now the system issued sell signal... at 1560
UPDATED chart - it looks like wave 3, small bounce and one more move lower to the next support level 1530-1540. I say we saw the top and the correction has begun. If this move is reversed again I will shoot myself:)
 The move last week was definitely exhaustion as I have suggested. It is 100% not the start of a new rally, a trap nothing more. When you have the start of a new move there is huge bar followed by 1-2 days pause and another huge bar up - what do we have now? a joke, this is not bullish.
The move lower is not a surprise... it is even more bearish than expected. There is very high probability that a move lower has begun and we saw the top, especially if we do not see rebound in the afternoon session. Any move higher is now an opportunity for a short entry. There is two zones around 1580 and 1590 where a move higher should reverse. Lets hope that we will see a bounce from support and nice opportunity for an entry.
The move last week was definitely exhaustion as I have suggested. It is 100% not the start of a new rally, a trap nothing more. When you have the start of a new move there is huge bar followed by 1-2 days pause and another huge bar up - what do we have now? a joke, this is not bullish.
The move lower is not a surprise... it is even more bearish than expected. There is very high probability that a move lower has begun and we saw the top, especially if we do not see rebound in the afternoon session. Any move higher is now an opportunity for a short entry. There is two zones around 1580 and 1590 where a move higher should reverse. Lets hope that we will see a bounce from support and nice opportunity for an entry.

Apr 13, 2013
Weekly review
Short term view - probably retest of 1575 break out.
Intermediate term view - probably short living correction 3-4 weeks in Mai.
Trading system signal (swing trading) - Direction: UP | Last entry signal: at SP500=1560 on 08.04.2013 | Stop at:1565
I have warned last week that we can expect something on the upside because the price is still in the channel and above EMA50... well I did not obey my system, which gave long signal on Monday and missed the move waiting for a pullback.
Everything what I follow - technical analysis, market breadth, Tom Demark Sequential, Cycles says we should see correction, but price action does not confirmed this... not yet. And we are trading the price so we should follow it. Watching the smaller times frames there is no signal for a top just a pause before another move higher. Intermediate term direction stays up, short term we should see another move lower to around ~1575 support, 38,2% Fibo retracement and EMA50 on the hourly chart.
The current move is maybe last blow off to trap most of the traders, but for that to be the case I want to see a top next week. Probably test of the previous top around 1575 marginal high above 1600 with divergence. The swing is lasting already too long and the size is bigger than an average swing. Simple - we have the expected correction soon or something else is going on. Something else could be euphoria stage - indexes move higher with some set backs for 2-3-4 days ~20-30 points along the way. In percentage term the indexes will not move much higher ~5% something like 1650-1700 but imagine the euphoria..... all time highs,the market will never correct, fed will not allow the market to go down, this is new secular bull market,this time is different. It sounds bullish but it is not. Corrections let the market bleed an balance the greed. This is good for a bull market. Euphoria sucks in too much capital too soon and prematurely burning out the bull advance. Euphoria stages end in tears and if this is the case after a top probably in June expect very sharp and deep sell off ~15% more than 200 points.
TECHNICAL PICTURE
Short term - the move which started on Friday afternoon looks corrective but not finished. So the short term we should see positive start on Monday and another move lower to test the previous top around 1575. The alternate scenario is the indexes just continue moving higher - somebody surprised?

- Triple cross(EMA10 and EMA20 crossing EMA50) - short term moving averages and price above EMA50. Short term direction is up.
Intermediate term - I think we will see another higher high next week, but the double divergence on MACD says just marginal new high to kiss my trend line for good bye:).
When... if:) the correction starts the price will flirt for a while with the trend line and EMA50 before move lower for 2-3 weeks.

- Trend direction EMA50/MACD - price is above EMA50 and MACD above zero so intermediate term trend is still up, but we have double MACD divergence and we must be careful. When the price break bellow EMA50 and MACD bellow zero beware of violent move lower.
- Momentum Histogram/RSI - momentum is positive.
Long term - the idea stays the same expect correction but this is not a major top. DJIA RSI made new record high above 78 for the bull market. That is very extreme for a weekly chart. We had four such occasions and the result was twice very deep counter trend move and twice correction 9%-11%. It will not be different this time. Stretching into euphoria stage is not very healthy for a bull market.

- Trend direction EMA50/MACD - MACD is above the zero line and the price above EMA50, the long term trend is UP. No divergences so I think that the cyclical bull is not over.
- Momentum Histogram/RSI - momentum is positive but stretched, RSI making record highs for the bull market.
MARKET BREADTH INDICATORS
The Market Breadth Indicators - not really excited about the rally, this is not something new this is for months. The indicators are levitating at their upper range. Only the McClellan Oscillator jumped above the zero line currently at 2.... not really very strong.
McClellan Oscillator - jumped above the zero which is no surprise it was at oversold levels.
McClellan Summation Index - no change, we have a divergence and a sell signal.
Weekly Stochastic of the Summation Index - still on sell.
Bullish Percentage - moved above EMA10 but we have another lower high another divergence... for now.
Percent of Stocks above MA50 - jumped above 75 but made another low high and double divergence now.
Fear Indicator VXO - still showing divergence but nothing serious.
Issues Advancing - in the middle of the range there is not really many stock advancing which means the rally is not really broad based.
Issues Declining - in the middle of the range there is enough stock declining, underneath the surface there is weakness.
HURST CYCLES
Such move should be the begging of a new cycle and I think we saw the bottom of 40 trading day cycle. The alternate scenario is we saw bottoming longer than usual 20 day cycle. Currently at day 5 of the next cycle so there is at least several days more upside expected.

At week 7 of the 20 week cycle. I think the 40 week cycle is dominant.

Tom Demark SEQUENTIAL AND COUNTDOWN - this technique spots areas of exhaustion.
Posted monthly chart very interesting and import to mention is that all time frames will complete combo synchronously.
As expected the setup lower was negated and we have now 12 of a combo. Next week after higher high it should be finished. We have 8 of a countdown and if the move just continue higher expect the 13 countdown to be finished.

We are seeing 12 combo on the weekly chart another higher high next and it will be completed and I think we will see this 13.

I do not pay much attention to very long term charts because my trading horizon is short and today playing with the monthly chart, I realized that this is a big mistake:)
First look at MA20 - simple and easy, you know if you are in bear or bull market and it is usually support/resistance through the whole bull/bear market. At the moment the market is way too far from MA20 expect a snap back to the moving average. Bullish case sideway move for several months so the moving average can catch up with the price.
I am not very good with EW it is more for fun... my two cents the market is ready for the next X wave. If you measure the size of the moves for the second light red W (the current move since Oct 2011) the first rally to April 2012 is 348 points, add them to the bottom in June 2012 and this is 1614... we are veeery close to the target where A=C. Of course this is monthly chart and it could last 1-2-3 months before we see the top. Another steep drop will scare the shit out of the central bankers and if they continue trying so desperately to save the current system at all costs, and there is no doubt about that, I think the bull can surprise us with one more leg higher into H1 2014.
Tom Demark - amazing how good the counts work:) This month we have setup and combo finishing and countdown at 12. We have the same situation like before the big red X - setup+combo an second setup within the combo. Time for the next X?
I know we saw many setups/combos/countdowns come and go for the current move an the price just continues moving higher and higher.... I think this time is different:) The strongest signal is when the counts at all time frames start completing synchronously at the same time. Now look at the daily,weekly and monthly chart - wow next week we should see setup+combo finished on all time frames. It might not be this month, but X wave of a bigger degree should be around the corner.

Apr 10, 2013
Short term update
UPDATE: I do not see anything bearish probably next week retest of the break out around 1575... no top in sight the small charts show that there is one more push higher, I was wrong.
P.S. I have forgotten to mention that the system gave a long signal on Monday. I wrote it in an answer to a comment... and I was waiting for a pullback.
UPDATE: Target 1585-1590 reached without pullback.... very nice:(
I think we are seeing blow off move with an exhaustion bar today. RSI on the weekly chart made record high today for the whole rally since 2009 - what does it mean? First strength this is not major top and the end of the bull market. Second expect correction.... I think all bears are killed and everybody is celebrating the new all time highs.
Usually I do not call tops, but if I am right this is the top or we will see it next week 5-10 points higher with divergence. If I am wrong you can call me idiot trying to pick a top, when we have such a great bull market:))
Apr 9, 2013
Short term update
UPDATE: Pullback is running... I will watch the 1555-1560 area for long entry for 2-3 days with target 1585-1590. If SP500 drops bellow 1550 than short.
UPDATE: It is definitely up:) vertical move on the hourly, RSI at 76,3 on the weekly... without pullback, sorry but I would not chase such moves.
Not sure which scenario is playing out. Two shooting stars on the hourly chart so I expect some move lower. I will watch the 1550-1555 area and according to the action around this levels we will position long or short. The stop has been moved 1 point higher at 1567 just above the shadows of the two candles.
This price action is not a surprise. I wrote in the weekly review that the price is still in the channel and above EMA50, which means that even higher high is possible. I also wrote, that we are in the middle of a topping process. Whatever we see lower or higher high I still think that this is just topping action and not the beginning of a new move higher. If you look at the European indexes or Russel 2000.... they does not look very good and does not support this current move.


Apr 6, 2013
Weekly review
Short term view - more on the upside next week, all this is part of the topping process.
Intermediate term view - I think that the correction has started - expect at least 4-6 weeks move lower.
Trading system signal (swing trading) - Direction: DOWN | Last entry signal: at SP500=1562 on 04.04.2013 | Stop at: 1566
We saw the squiggles on Monday and Tuesday follow my forecast and then the price broke bellow the last minor low and EMA50 on the hourly. The break was tested which was a nice opportunity for an entry on the short side. Overall the forecast was good enough for trading:)
A note about trading - it is much better when you trade such amount, so that you can take part of the profits - 2 contracts for example. There will be all the time situations, when you are not sure if the prices will continue moving higher/lower when they reach support/resistance. At such point it is a good idea to take some profits. No guessing and wondering if you right or wrong book some profits and you sleep well not worrying that you can stay with empty hands.
This week we had two such situations. On Tuesday the prices reached the upper channel at 1573 and I knew that there will be something to the downside, but with 1 contract and chasing bigger move if you are wrong you can end with nothing. On Friday huge bar lower 1 point shy of support than 3 hours and no follow trough at all - booking profit is not a bad idea.
This week as an example trading with 2 contracts - first trade on Tuesday take 1 contract profit at the upper trend line (I even wrote that you can take profits:) 12 points, second trade on Friday no follow trough for hours take profit 1 contract that is around 1547 or 15 points. Overall 27 points profit if you book part of the profits and holding the position... nothing:)
Ok is this the top or could it be just another pullback followed by a rally? Everything is possible - the indexes are still in the channel and above EMA50 on the daily chart so we must be cautious until we see confirmation. Statistically we should expect an intermediate term top and correction - the current swing is already a little bit bigger and longer than the average one and we had already two pullback along the way. The technical indicators and the market breadth indicators does not look good so I think that a top and correction have higher probability.
I think we will see a-b-c up (Friday was a) followed by a move lower which should break bellow the last minor low 1538,the trend line and EMA50 on the daily chart(see the second chart). Than buy the dip crowd will appear and we will see another lower high probably testing the broken trend line. After that the final move of the correction which is the strongest should follow. See the previous tops - this one will not be exactly the same but similar.
TECHNICAL PICTURE
Short term - the move bottomed 1 point shy of the support level 1538 and is 1 point shorter than the first drop:) I think that the move lower has bottomed and a new one to the upside has started. It should be a part of the topping process and should stay bellow resistance at 1564. As always the exact path is difficult to predict but the next week we should see pressure on the upside.
- Triple cross(EMA10 and EMA20 crossing EMA50) - short term trend is still down but I expect upward pressure and crosses again next week.
Intermediate term - we saw the first cracks but still there is no confirmation for bearish move - close bellow the last minor low 1538. You can see on the chart that the price is still in the channel and above EMA50. Look at the previous tops - I think that the indexes are still in the middle of a topping process and there will be up and down. The last phase of the correction will be the violent move lower and that will happen when the price break bellow the channel and EMA50.

- Trend direction EMA50/MACD - price is above EMA50 and MACD above zero so intermediate term trend is still up, but we have MACD divergence which warns us for troubles ahead. When the price break bellow EMA50 and MACD bellow zero beware of violent move lower.
- Momentum Histogram/RSI - momentum points lower.
Long term - the idea stays the same expect correction but this is not a major top. Momentum on the weekly chart has turned lower - RSI and Histogram.

- Trend direction EMA50/MACD - MACD is above the zero line and the price above EMA50, the long term trend is UP. No divergences so I think that the cyclical bull is not over.
- Momentum Histogram/RSI - has turned lower which warns us for a correction.
MARKET BREADTH INDICATORS
The Market Breadth Indicators - look very weak for weeks and support the idea for some kind of a correction. The McClellan Oscillator and some oscillators look oversold so again w should be still in a topping process and we will see up and down moves for a while.
McClellan Oscillator - did not react to the sell off on Friday which confirms that we should see more on the upside a-b-c
McClellan Summation Index - no change, we have a divergence and a sell signal.
Weekly Stochastic of the Summation Index - issued sell signal.
Bullish Percentage - we have a divergence and a sell signal.
Percent of Stocks above MA50 - we have a divergence and a sell signal.
Fear Indicator VXO - divergence the indexes should move lower.
Issues Advancing - made lower low but nothing impressive the real correction has not yet begun.
Issues Declining - still quite... we have not seen jump in the number of declining issues, which hits that we are still topping, and the real correction has not begun.
HURST CYCLES
Currently at day 12 of the 20 day cycle. It topped out at day 9 which is earlier in the cycle suggesting that a corrective move has begun. I think that the top of the bigger 40 day cycle was on Tuesday. Translated - the current short term move up should be an a-b-c corrective move making lower high followed by a move lower into the 40 day cycle bottom.

At week 6 of the 20 week cycle. Again I think the 40 week cycle is dominant and the current 20 week cycle should top earlier.
P.S. There is an one year cycle which is not a Hurst cycle, but it is very consistent since 2009 - we see tops in April and bottoms in June. Looking at the technicals and the Hurst cycles it fits perfect and I think that this cycle will not disappoint us:)

Tom Demark SEQUENTIAL AND COUNTDOWN - this technique spots areas of exhaustion.
We have a price flip and 3 of a setup which confirms that the momentum shifted to the downside. I doubt that this setup will be finished. Usually the first part of a correction is very choppy and I think that this setup will be negated next week.

Nothing interesting - I doubt that the countdown will be finished before a correction.

Intermediate term view - I think that the correction has started - expect at least 4-6 weeks move lower.
Trading system signal (swing trading) - Direction: DOWN | Last entry signal: at SP500=1562 on 04.04.2013 | Stop at: 1566
We saw the squiggles on Monday and Tuesday follow my forecast and then the price broke bellow the last minor low and EMA50 on the hourly. The break was tested which was a nice opportunity for an entry on the short side. Overall the forecast was good enough for trading:)
A note about trading - it is much better when you trade such amount, so that you can take part of the profits - 2 contracts for example. There will be all the time situations, when you are not sure if the prices will continue moving higher/lower when they reach support/resistance. At such point it is a good idea to take some profits. No guessing and wondering if you right or wrong book some profits and you sleep well not worrying that you can stay with empty hands.
This week we had two such situations. On Tuesday the prices reached the upper channel at 1573 and I knew that there will be something to the downside, but with 1 contract and chasing bigger move if you are wrong you can end with nothing. On Friday huge bar lower 1 point shy of support than 3 hours and no follow trough at all - booking profit is not a bad idea.
This week as an example trading with 2 contracts - first trade on Tuesday take 1 contract profit at the upper trend line (I even wrote that you can take profits:) 12 points, second trade on Friday no follow trough for hours take profit 1 contract that is around 1547 or 15 points. Overall 27 points profit if you book part of the profits and holding the position... nothing:)
Ok is this the top or could it be just another pullback followed by a rally? Everything is possible - the indexes are still in the channel and above EMA50 on the daily chart so we must be cautious until we see confirmation. Statistically we should expect an intermediate term top and correction - the current swing is already a little bit bigger and longer than the average one and we had already two pullback along the way. The technical indicators and the market breadth indicators does not look good so I think that a top and correction have higher probability.
I think we will see a-b-c up (Friday was a) followed by a move lower which should break bellow the last minor low 1538,the trend line and EMA50 on the daily chart(see the second chart). Than buy the dip crowd will appear and we will see another lower high probably testing the broken trend line. After that the final move of the correction which is the strongest should follow. See the previous tops - this one will not be exactly the same but similar.
TECHNICAL PICTURE
Short term - the move bottomed 1 point shy of the support level 1538 and is 1 point shorter than the first drop:) I think that the move lower has bottomed and a new one to the upside has started. It should be a part of the topping process and should stay bellow resistance at 1564. As always the exact path is difficult to predict but the next week we should see pressure on the upside.

- Triple cross(EMA10 and EMA20 crossing EMA50) - short term trend is still down but I expect upward pressure and crosses again next week.
Intermediate term - we saw the first cracks but still there is no confirmation for bearish move - close bellow the last minor low 1538. You can see on the chart that the price is still in the channel and above EMA50. Look at the previous tops - I think that the indexes are still in the middle of a topping process and there will be up and down. The last phase of the correction will be the violent move lower and that will happen when the price break bellow the channel and EMA50.

- Trend direction EMA50/MACD - price is above EMA50 and MACD above zero so intermediate term trend is still up, but we have MACD divergence which warns us for troubles ahead. When the price break bellow EMA50 and MACD bellow zero beware of violent move lower.
- Momentum Histogram/RSI - momentum points lower.
Long term - the idea stays the same expect correction but this is not a major top. Momentum on the weekly chart has turned lower - RSI and Histogram.

- Trend direction EMA50/MACD - MACD is above the zero line and the price above EMA50, the long term trend is UP. No divergences so I think that the cyclical bull is not over.
- Momentum Histogram/RSI - has turned lower which warns us for a correction.
MARKET BREADTH INDICATORS
The Market Breadth Indicators - look very weak for weeks and support the idea for some kind of a correction. The McClellan Oscillator and some oscillators look oversold so again w should be still in a topping process and we will see up and down moves for a while.
McClellan Oscillator - did not react to the sell off on Friday which confirms that we should see more on the upside a-b-c
McClellan Summation Index - no change, we have a divergence and a sell signal.
Weekly Stochastic of the Summation Index - issued sell signal.
Bullish Percentage - we have a divergence and a sell signal.
Percent of Stocks above MA50 - we have a divergence and a sell signal.
Fear Indicator VXO - divergence the indexes should move lower.
Issues Advancing - made lower low but nothing impressive the real correction has not yet begun.
Issues Declining - still quite... we have not seen jump in the number of declining issues, which hits that we are still topping, and the real correction has not begun.
HURST CYCLES
Currently at day 12 of the 20 day cycle. It topped out at day 9 which is earlier in the cycle suggesting that a corrective move has begun. I think that the top of the bigger 40 day cycle was on Tuesday. Translated - the current short term move up should be an a-b-c corrective move making lower high followed by a move lower into the 40 day cycle bottom.

At week 6 of the 20 week cycle. Again I think the 40 week cycle is dominant and the current 20 week cycle should top earlier.
P.S. There is an one year cycle which is not a Hurst cycle, but it is very consistent since 2009 - we see tops in April and bottoms in June. Looking at the technicals and the Hurst cycles it fits perfect and I think that this cycle will not disappoint us:)

Tom Demark SEQUENTIAL AND COUNTDOWN - this technique spots areas of exhaustion.
We have a price flip and 3 of a setup which confirms that the momentum shifted to the downside. I doubt that this setup will be finished. Usually the first part of a correction is very choppy and I think that this setup will be negated next week.

Nothing interesting - I doubt that the countdown will be finished before a correction.

Apr 4, 2013
Short term update
UPDATE 05.04.2013 - nothing much to say, it worked out exactly as I draw it yesterday (the second chart). No reason to change something.... Probably short term bottom on Monday or Tuesday and rebound.
I think one more move lower is in the cards... worst case higher low but near to the previous low.
 EMA50 touched at the hourly chart short at 1562 no stop..... now waiting
It looks like this to me...
EMA50 touched at the hourly chart short at 1562 no stop..... now waiting
It looks like this to me...

 EMA50 touched at the hourly chart short at 1562 no stop..... now waiting
It looks like this to me...
EMA50 touched at the hourly chart short at 1562 no stop..... now waiting
It looks like this to me...

Apr 3, 2013
Short term update
UPDATE: I will wait for the oscillators on the 15min and 1h chart to reset before a short entry. On Friday there is NFP and probably the indexes will be pushed higher until then.
UPDATE: the direction is definitely down - candlestick and histogram on the daily chart bearish and now triple cross on hourly chart. The only question is jump on the short side right now or wait for a pullback... Ohh and this signal will be for a swing trade several weeks not like the the last weeks a day or two.
It looks like this.... on the side line and waiting now. It did not worked out as I have expected:) good choice if you took profits at the trend line.
The daily chart starts looking ugly. If the indexes does not recover in the afternoon session short signal will be knocking on the door.
I wrote we are chasing the last 10-20 points and it is more day trading now...


Apr 2, 2013
Short term update
UPDATE 03.04.20013 - ok the lower target has been reached now waiting excitedly for the last wave:)) or the stop to be hit:(
The stop is now at break even (1561).... You can take profits at the trend line or wait for one more push, according EW theory two waves are missing:)
1563 is 61,8% Fibo level, support area with three minor peaks at this level (which are now support), the trend line is around there, EMA50 will catch us soon too, so max retracement should not exceed 1562-1563.
I am not EW guy but I was playing a little bit with counts and W-X-Z fits perfect. The sizes match and another 25 points means 1583 which is exactly in the middle of my target 1580-1585.
Complex zigzags have 7 waves for double zigzag and 11 waves for triple zigzag. The current move has 9 waves which means two waves are missing.


Apr 1, 2013
Short term update
UPDATE: Hammer on the hourly chart and close above EMA50, MACD positive divergence on the 15min chart.... it looks good for now. The trend line was pushed a little bit lower. I did not know where exactly the bottom will be so I did not use stop. Now we know where the minor low is and with all positive signs it should hold - which means stop at 1557.
Long at 1561... no stop for now. Lower trend line and EMA50 at the hourly chart touched.
And the chart after the close....


Subscribe to:
Posts (Atom)