Mar 28, 2020

Weekly preview

One more low completed the pattern and retracement is running. MCO and RSI with double divergences and those expecting much lower are disappointed as expected.

Many are trying to count this as w4... this weekly candle does not look like the weakest wave to me. At the moment I think we have correction higher, which should take time another 3-4 weeks. For the big picture I have a suspicion that we have a combination this wave up could be X, but for that I want to see 62% retracement exceeded.


TECHNICAL PICTURE and ELLIOTT WAVES
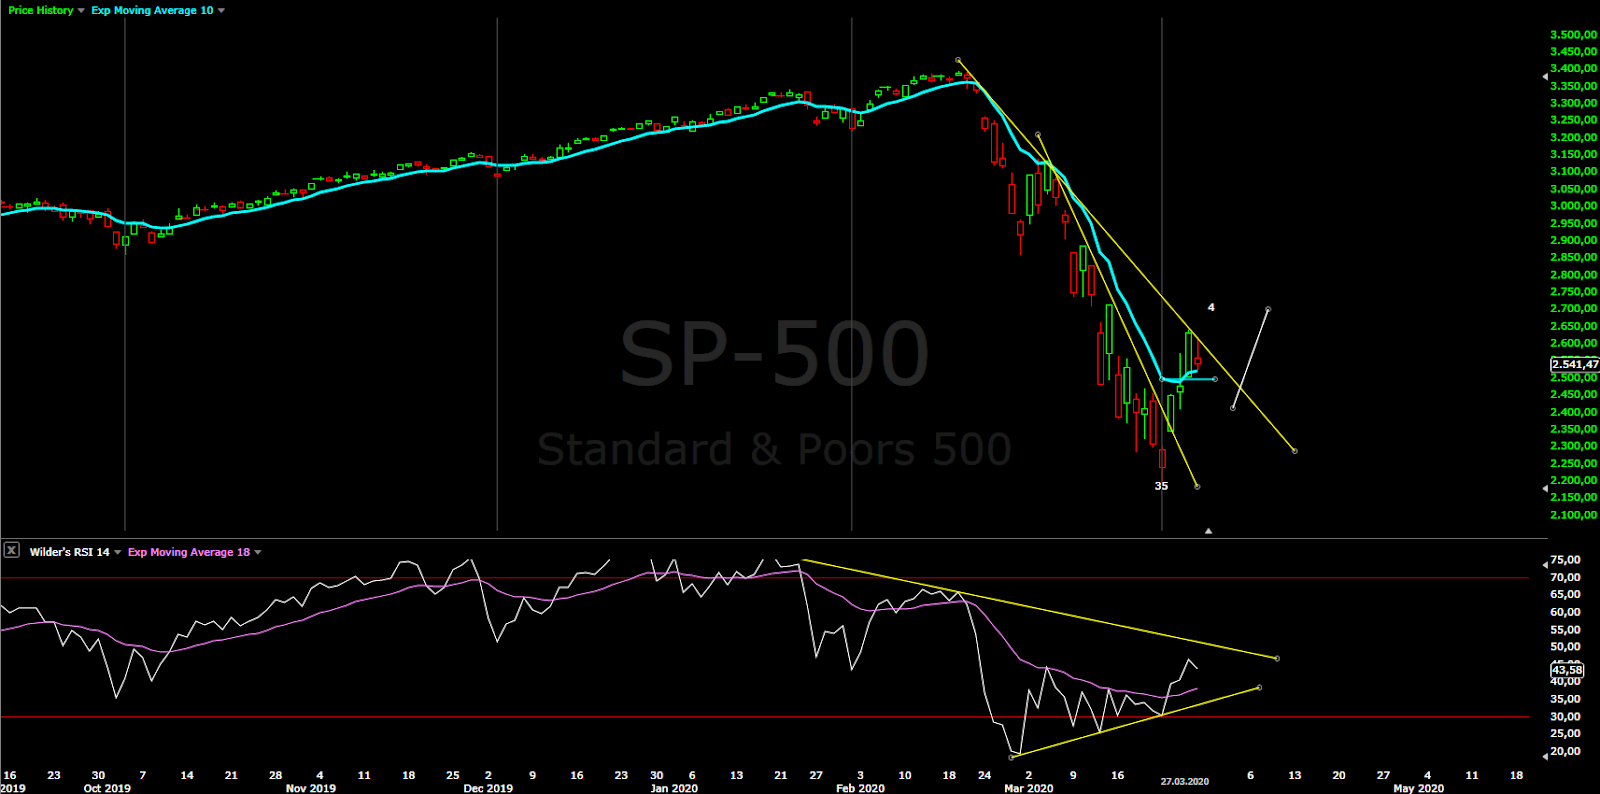
Short term - I see a wedge and a break out higher. RSI broke the trend line and we need a pullback to establish the new trend line.
The move lower counts better as a-b-c and not as an impulse. To the upside - the cash index is not so clear, but the futures are showing impulse so we should see more to the upside after a pullback. It should be some pattern, which takes time. The retracement has just begun so the path shown below is speculation at the moment.
As long as the red line is not crossed this move up is not in danger.


Intermediate term - RSI with double divergence and we have move up. I think it should take another 3-4 weeks for 20w cycle high. 2900 looks like a good target to close the gaps and to test MA200, resistance and 62% retracement.


Long term - some already counting completed correction(expanded flat) other trying to fit impulse lower(the bull market is over). I do not think that it is so simple. In a few weeks we will know more. Some EW thoughts:
- if the correction is over with a flat we should see impulse higher. Than this should be i/1/V... too big too fast for my taste - suspicious.
- the bull market is over - then we should see impulse lower. If this is 1 for five weeks than around the end of the year SP500 will be at 500 - unrealistic. Realistic is "a" and the next one big zig-zag below.
- big zig-zag from Feb.2020 is running and it is so bad - than this is b and should hit 50% retracement and stay below the 62% or zig-zag will be negated. There is no such pattern expanding W-X-Y so suspicious. No, it is not expanding triangle either.
- the retracement takes longer and reaches 62% Fibo level or exceeds it - probably X wave and we have combination flat+X+corrective pattern. For NDX and SP500 big triangle could be an option, but for other indexes it will not work so well.

Too much theory from trading perspective just wait for the important cycle low - higher low or lower low with divergence. This will be the low risk trade.


MARKET BREADTH INDICATORS
Market Breadth Indicators - some are showing strength so this move up should not be just three days wonder quickly reversed.
McClellan Oscillator - reached slightly overbought level after divergence.
McClellan Summation Index - trying to turn up.
Weekly Stochastic of the Summation Index - sell signal, trying to turn up.
Bullish Percentage - sharp move higher, reached 70 with a buy signal.
Percent of Stocks above MA50 - trying to turn up, it will take time MA50 is far away.
Fear Indicator VIX - elevated levels. I think it should drop more before we see another surge higher.
Advance-Decline Issues - sharp move up.


HURST CYCLES
Daily(trading) cycle - buy signal was triggered, the price and RSI broke above the MA. The first trend line was broken, probably pullback and break above the second one. The next move lower should be corrective and it is a buy.
Do not forget - this trigger is nothing more than flip switch buy/sell. You have to put it in the context of the price action and the expected price action is corrective higher for a few weeks. If you are not comfortable with that ignore it.
Overall 35 days is a good length for the daily cycle and I think the next one is running.


Hurst cycles - adjusted the sine waves to fit the price action. I think we have 10w cycle low and next we should see several weeks higher for 20w cycle high.


Week 8 for the 20w cycle. Strong move up - most likely we have 10w cycle low.

Mar 21, 2020

Weekly preview

Another volatile week, more zig-zags and the next Fibo level 1,618 reached. I still think corrective pattern a-b-c counts much better. When you try some how to justify impulse it is just not an impulse.

In the last long term update I wrote we should see smaller version of 2008 - everything should be sold and the USD higher. Bonds after initial flight to safety are lower 20%(TLT) just like in late 2008 early 2009 before the bottom, the USD joined the party and it is sharply higher. Now it is only gold which refuses to comply:) it should retrace to support 1300-1350 and the picture will be complete.
The point is focus on the long term - this should be important 9 year cycle low, plenty of shares with clear corrective patterns.... look for opportunities.


TECHNICAL PICTURE and ELLIOTT WAVES
Short term - it looks like a-b-c to me. One option is c as a diagonal(red) which is not completed... I am leaning more towards second leg as w-x-y or completed ED(green). We will know on Monday.
RSI is compressed now between the two trend lines and break out is imminent. I think it will be to the upside.

AAPL reached the support area with clear corrective pattern - I do not see how this overlapping mess is impulse third wave. It is a summary for the pattern which many shares have, especially in the tech sector.


Intermediate term - next week we should see a bottom and I expect at least 50% retracement. The price is ridiculously stretched way too far from MA200. The more far away it is pushed, the more violent the snap back. On the way up the price was too far away from MA200 and now this distance below it, is even more crazy - 2.5 times bigger. Expect MA200 to be tested.


Long term - the trend line has been reached one option is the price low has been hit and subsequent higher low(green) the other option is lower low, but first lets see the retracement.


MARKET BREADTH INDICATORS
Market Breadth Indicators - extremes, VIX with a level seen in 2008 and McClellan Summation Index level seen in 2002/2008. Those who think there is much more lower to come will be disappointed.
McClellan Oscillator - short term divergences and turned up, heading to the zero line. Yesterday positive despite the 4% lower.
McClellan Summation Index - sell signal, extremely oversold levels.
Weekly Stochastic of the Summation Index - sell signal, oversold level.
Bullish Percentage - turned up, showing signs of life.
Percent of Stocks above MA50 - most stocks are far away from MA50, so it will stay for a while at this extreme levels.
Fear Indicator VIX - extreme level seen in 2008, now a log way lower begins.
Advance-Decline Issues - turned up.


HURST CYCLES
Daily(trading) cycle - still sell signal, but the cycle is mature at day 34. RSI with double divergence and preparing to burst above MA18, and M10 is catching up with price. It should not last long to see a buy signal.


Hurst cycles - speculating that we have shorter cycles and now we are seeing 10w low. Next move up should follow for 20w cycle high.


Week 7 for the 20 week cycle. Usually such sharp moves are compressed in time and the cycles are shorter - speculating that we have 10 week cycle high and low with length 7 weeks.

Mar 14, 2020

Weekly preview

"Texas chainsaw massacre" episode 2 at a cinema near you:) The whole "strong" rally wiped out for three weeks, just the tech sector holding.
I know for many it is not funny, but I take it with humor. At the end it is just money it should not be the most important in your life. Look at it from the bright side - great buying opportunity. The highs will be exceed in the next years, just be more wise next time and do not fight the pattern and cycle even the FED can not:)

It was much worse than expected second leg lower with 162% extension instead of 62%. After such powerful first leg you do not expect extended second leg, but there it is.
The pattern - there is two legs lower which is zig-zag for me and this is wave "a" of a bigger a-b-c zig-zag. Alternate somehow we have another lower low next week, then I have to count impulse. In this case the price low will be the low for the pattern expanded flat and trading/cycle low will be later in June testing the low with higher low(see weekly chart).

More interesting is the big picture, remember what I wrote in the long term update - pretty much everything lower, USD and bonds higher. We saw crude oil/energy stocks massacre, then the indexes, silver and gold miners joined the party, even the cryptocurrencies followed and in the mean time bonds shoot up through the roof.
Only gold is still at elevated levels and USD not making new high... we have definitely blood on the streets in every sector and it feels like mass liquidation event mini 2008 exactly what I was expecting. The point is it is happening now and I see levels, which I was expecting to see in June not in March.
My best guess is probably this is the worst part of the correction and in June we will see test of the low - lower lows but not much lower.

P.S. it is not fun many people died, but judging by the cycles in the summer all this virus story will be over. I know what most will say another "virus expert", but everything in this world is interconnected. The cycles do not arise from nothing they are reflection of what is happening in the world, this is shaping the mood and this mood is reflected in the price movements.


TECHNICAL PICTURE and ELLIOTT WAVES
Short term - there is two legs lower, for impulse you need one more low. The problem I have with this impulse is in the third wave there is no waves 2 and 4 just one reaction in the middle which divides it in two equal parts which is zig-zag not third wave. Second the price action is 1:1 with Dec.2018 the Fibo relationships, this one day in the middle of the second leg, the mega reversal(>12% the futures). Back then the wave ended as double zig-zag wave y. Why should be counted different this time? Every wave has it's personality - w4 should be the weakest. 12% rally, closing at the high for the day, printing bullish reversal candle, all this at the end of the week(very important). All this are signs for a reversal not for the weakest wave.


Intermediate term - I think we should see retracement which takes time, many weeks even into May will be perfect. The market needs to calm down first. The retracement should be corrective, reaching 50% less likely 62% and closing at least two gaps, the third will be a bonus:)
From the beginning I am watching the Oct-Dec.2018 decline for a guidance. History does not repeat, but it rhymes. It seems this time we have the strong leg first and the next one should be the weaker one. Both strong legs then and now are exactly the same just on bigger scale this time. Interesting if we will see again a flat as a pattern to burn time. There is no much options the others are triangle and combination.


Long term - C wave lower running. Both scenarios adjusted after the huge drop. From the beginning of the decline following the triangle pattern, it is more likely.


MARKET BREADTH INDICATORS
Market Breadth Indicators - hammered down.... oversold to the power of two. Turning up from extreme oversold levels. We will see tests of the lows price and indicators.
McClellan Oscillator - extremely oversold twice and turned higher.
McClellan Summation Index - sell signal, extreme level associated with important lows.
Weekly Stochastic of the Summation Index - sell signal, oversold.
Bullish Percentage - turned up from 1, crazy.
Percent of Stocks above MA50 - turned up from 1, crazy.
Fear Indicator VIX - challenging 2008, crazy.
Advance-Decline Issues - small short term divergence and turned higher.


HURST CYCLES
Daily(trading) cycle - sell signal. First MA10 should be tested then we will see another low after that expect buy signal to be triggered. Low risk trade is the next low - lower or higher what ever comes.


Hurst cycles - we have a low this week as expected and what for a low. Usually when you have such steep decline the cycles are getting shorter. I will make the assumption that both cycles will consist of 6x20d cycles and not 8. So next we should see 10w cycle high in 1-1,5 weeks.


Week 6, given the steep decline the cycle should be shorter more like 18 not 22 weeks.

Mar 7, 2020

Weekly preview

Bounce from oversold levels as expected, now watching the test of the low. Ideally we should see slightly lower low next week, then multi week move higher to reset the indicators from extremely oversold levels.
Last week discussed a lot if this big move lower is corrective or impulse. For me it counts better as a zig-zag. Accordingly main scenario is now C wave as a zig-zag and alternate impulse for C.
What pattern we have with a third zig-zag since 2018? I think this is wave C of a triangle(see the monthly chart below).


TECHNICAL PICTURE and ELLIOTT WAVES
Short term - I see a-b-c lower with c=0,62xa. After that we have another a-b-c higher retracing 50%. For a perfect pattern will be nice to see slightly lower low to complete A-B-C from the top with C=0,62xA.


Intermediate term - intermediate term low expected soon and multi week move higher. Watch RSI to move to >60 but below 70, MACD close to the zero line. The price should not exceed 62% retracement around 3200.


Long term - C wave lower running. I expect to see zig-zag lower from a triangle, impulse is now the alternate scenario.

Monthly chart how I see the big picture. With three zig-zags the most likely pattern is a triangle. I do not think it is ED in this case wave IV is too short - 3 months or 1 year. Triangle is good alternation to expanded flat II and good time retracement for III - 3years/7years roughly the expected 38%. At least time should be retraced when price retracement is shallow.
The big adjustment is where the 4 year cycle high is. If you look at the cycles(high-to-high) since 2007 they are shorter 3,5-4 years. If you put the 4y high at the start of the corrective pattern(triangle), where it should be, it falls in line perfect with the sequence.... which runs almost perfect(red 4y cycle highs, purple 4y cycle lows).
I should have known better - B bigger than 1,618%, alternation to wave II needed, looking at cycles further than 4 years... in hindsight is always easy:) Not that many are seeing triangle even now, I know only one guy.


MARKET BREADTH INDICATORS
Market Breadth Indicators - we should see bottoming with divergences and reset from very oversold levels lasting for weeks.
McClellan Oscillator - still very low levels, divergence developping.
McClellan Summation Index - sell signal.
Weekly Stochastic of the Summation Index - sell signal, in oversold territory for a while.
Bullish Percentage - sell signal, waiting for bottoming.
Percent of Stocks above MA50 - expect to see a divergence and move higher for a few weeks.
Fear Indicator VIX - huge reversal on Friday, expect lower high and cool off to normal levels.
Advance-Decline Issues - very oversold levels, it should turn higher.


HURST CYCLES
Daily(trading) cycle - the signal is still sell. The price and RSI tested the MAs. We should see one more low and turn higher, which will trigger buy signal.


Hurst cycles day - it looks like double top at days 27-28 right on schedule for 5w high. If the short term cycles continue to work so good next is 5w low mid next week.


Week 5 for the 20 week cycle. Why I do not think this is 20w cycle low? Think about it you have extremely strong right translated 20w cycle up for 19 weeks what should happen next - 1-2-3 weeks insignificant move lower and another higher high. Retracing the whole strong 20w cycle for just one week does not make sense at all.
I would describe it this way - from trading perspective it is the 20w cycle low to trade and I will not be surprised to see two months higher for market breadth reset and 20w cycle high, but from theory perspective it is not.