
Mar 31, 2016
Update
The pullback from last week was only corrective two waves lower. I was waiting for confirmation if a bigger pullback has begun... no confirmation we have another impulse higher which is not finished.
No change for the intermediate term - bullish ew patterns,cycles,market breadth, TomDemark sequential.... but expecting a bigger pullback after this wave is finished and 40 day cycle low.
Clear corrective move lower and impulse higher. Short term wave 4 is running lower to support previous high, to fill the gap and 38,2% Fibo retracement. The next resistance level is 2080-2090 and one missing wave higher to exactly this levels is expected.

Mar 26, 2016
Weekly preview
Short term view - waiting for confirmation for a short term top and a move lower.
Intermediate term view - pullback in April expected.
Quiet week, the indexes struggling to move higher and finished with small loss as expected. Nothing new, waiting to see confirmation if a pullback has begun. Current thoughts: - EW - I think this is either wedge or impulse is running(green scenario). - TA - see the second chart. When you see the histogram showing strength(strong move up/down or spending time above/below 0) expect subsequent top/trough with divergences. There is no guarantee higher or lower high, but the high should be tested. - Market breadth - showing strength in overbought territory for a while. Usually when you see such strength expect another high with divergences before more significant top. Market breadth favors the green scenario. - Cycles - currently day 29 of a 40 day cycle. Cycles look bullish - we have right translated cycle. Usually the next one makes higher high. Cycles favor the green scenario. - TomDemark Sequential - needs a few more days making higher highs to finish countdown or combo. With the bullish scenario a sequential will be finished, but this is not a guarantee that this will happen. Overall I can not see imminent reversal, higher high will look better, but this is not a guarantee. We have to see first how a pullback develops. I expect a pullback in April and the second intermediate term top in Mai. TECHNICAL PICTURE
Short term - only two legs lower so waiting for confirmation for a reversal. Both scenarios are shown wedge and an impulse after the first wave lower will know more which is it.

Intermediate term - the paths for both scenarios are shown with two 40 day cycles which should finish a 20 week cycle.
The histogram with divergences. When you see a sharp move lower/higher usually the bottom/top is tested.
Long term - no change. Indicators look bullish so worst case is topping with lower high before any strong move lower.

MARKET BREADTH INDICATORS
The Market Breadth Indicators - are turning down from overbought levels and a pullback is expected for the indexes.
McClellan Oscillator - below zero.
McClellan Summation Index - buy signal.
Weekly Stochastic of the Summation Index - at overbought territory waiting for the next swing lower.
Bullish Percentage - turned lower, but still buy signal.
Percent of Stocks above MA50 - turned lower after very overbought level around 95%.
Fear Indicator VIX - turned up.
Advance-Decline Issues - heading lower from overbought levels.
HURST CYCLES
Short term cycles are shown on the second chart daily.
Long term week 6 of the current 20 week cycle. This is the bearish scenario with one more zig-zag lower.
Tom Demark SEQUENTIAL AND COUNTDOWN - this technique spots areas of exhaustion.
Week 6 of a sell setup on the weekly chart. On the daily we need one more wave higher to finish combo or countdown.
Intermediate term view - pullback in April expected.
Quiet week, the indexes struggling to move higher and finished with small loss as expected. Nothing new, waiting to see confirmation if a pullback has begun. Current thoughts: - EW - I think this is either wedge or impulse is running(green scenario). - TA - see the second chart. When you see the histogram showing strength(strong move up/down or spending time above/below 0) expect subsequent top/trough with divergences. There is no guarantee higher or lower high, but the high should be tested. - Market breadth - showing strength in overbought territory for a while. Usually when you see such strength expect another high with divergences before more significant top. Market breadth favors the green scenario. - Cycles - currently day 29 of a 40 day cycle. Cycles look bullish - we have right translated cycle. Usually the next one makes higher high. Cycles favor the green scenario. - TomDemark Sequential - needs a few more days making higher highs to finish countdown or combo. With the bullish scenario a sequential will be finished, but this is not a guarantee that this will happen. Overall I can not see imminent reversal, higher high will look better, but this is not a guarantee. We have to see first how a pullback develops. I expect a pullback in April and the second intermediate term top in Mai. TECHNICAL PICTURE
Short term - only two legs lower so waiting for confirmation for a reversal. Both scenarios are shown wedge and an impulse after the first wave lower will know more which is it.

Intermediate term - the paths for both scenarios are shown with two 40 day cycles which should finish a 20 week cycle.
The histogram with divergences. When you see a sharp move lower/higher usually the bottom/top is tested.

Long term - no change. Indicators look bullish so worst case is topping with lower high before any strong move lower.

MARKET BREADTH INDICATORS
The Market Breadth Indicators - are turning down from overbought levels and a pullback is expected for the indexes.
McClellan Oscillator - below zero.
McClellan Summation Index - buy signal.
Weekly Stochastic of the Summation Index - at overbought territory waiting for the next swing lower.
Bullish Percentage - turned lower, but still buy signal.
Percent of Stocks above MA50 - turned lower after very overbought level around 95%.
Fear Indicator VIX - turned up.
Advance-Decline Issues - heading lower from overbought levels.
HURST CYCLES
Short term cycles are shown on the second chart daily.
Long term week 6 of the current 20 week cycle. This is the bearish scenario with one more zig-zag lower.

Tom Demark SEQUENTIAL AND COUNTDOWN - this technique spots areas of exhaustion.
Week 6 of a sell setup on the weekly chart. On the daily we need one more wave higher to finish combo or countdown.

Mar 21, 2016
Precious metals/gold miners
No doubt the price action for precious metals/gold miners is bullish
What we have so far is bullish behavior which points to further gains later this year. To sum up:
– EW - impulse higher, expect more to the upside after a correction.
– Cycles - important low I think it is 4/8 year cycle low followed by bullish right translated 20 week cycle. The move higher last longer compared with max 12 weeks higher for all 20 week cycles since 2011. This move is not part of the decline from 2011.
– market breadth - bullish behavior staying overbought for weeks which happens in a bullish move. This is not typical for bear market. Again this move is not part of the decline from 2011.
With impulse from the bottom, 20 week cycle low expected in Mai and probable 4 year cycle high this month what are the options:
– bearish – gold reversing and making new lows – I will give 0% probability to this scenario. I see nothing to support it.
– bullish – the move up is wave 1/A, correction lower into Mai for 2/B is expected and continuation higher 3/C. It is possible, but I think this scenario has lower probability and if you are gold bull, you do not want to see this. Vertical moves should appear at the end of a bull market not at the beginning. It is the same reason why I was calling bottoms for stocks in August and February - exhaustion way to early, this is not sustainable.
– the middle way – correction with higher low stretching in time to September-October so that the markets "digest" the vertical move up. I expect after a low in Mai one more 20 week cycle lower with possible higher high for gold miners in June-July.
The last one is my preferred scenario here is why:
1. Higher low because after an impulse the next move is a correction followed by new highs, but I expect the correction to stretch for a few months because of the reasons below.
2. Four year cycle top - see the post from SilentOne peak to peak cycle analysis for gold. Such a top usually causes move sideway/lower for a few months(see the chart from the post).
3. USD – if my analysis is right we are in a triangle and than we should see final move higher. Gold does not make bottom/top exactly
when USD makes it’s top/bottom, but strong moves start after USD top/bottom. Look at this chart(Rambus Chartology at Safehaven.com) and compare them. Gold bottomed in 1999 but it really took off after the USD made it’s final top, or the gold bear market begun 2011 when USD started it's move higher. I expect something similar gold bottomed earlier, correction for roughly 5-6 months and precious metals really taking off after the final USD top.
4. Gold majors NEM/ABX begun their move earlier than gold and they are already in a wave three. So after a bottom in Mai for wave 4 we should see higher high for wave 5 probably in June followed by a correction for several months. I can not imagine gold moving higher and majors moving lower. So the pattern for majors is pointing to a low in Mai, but more important low in September-October.
This way we will see majors like NEM/ABX, GDXJ and gold synchronizing their bottoms and blasting higher for the next wave up.
Maybe it sounds complicating, but the trading plan is simple - if you see three waves lower into Mai buy the bottom and we see what happens.If I am wrong we make money, If I am right we will make some profits and reload later in autumn again.
Here are the charts to see how my forecast for the next 6 months should look like:
Gold with the expected path if I am right. Support area around 1150, 50% and 61,8% Fibo retracement at the same levels.
Vertical lines are the 40 day cycle lows. Two 40 day cycles make one 20 week cycle. The first is expected to bottom in the first half of Mai. The second in September-October.
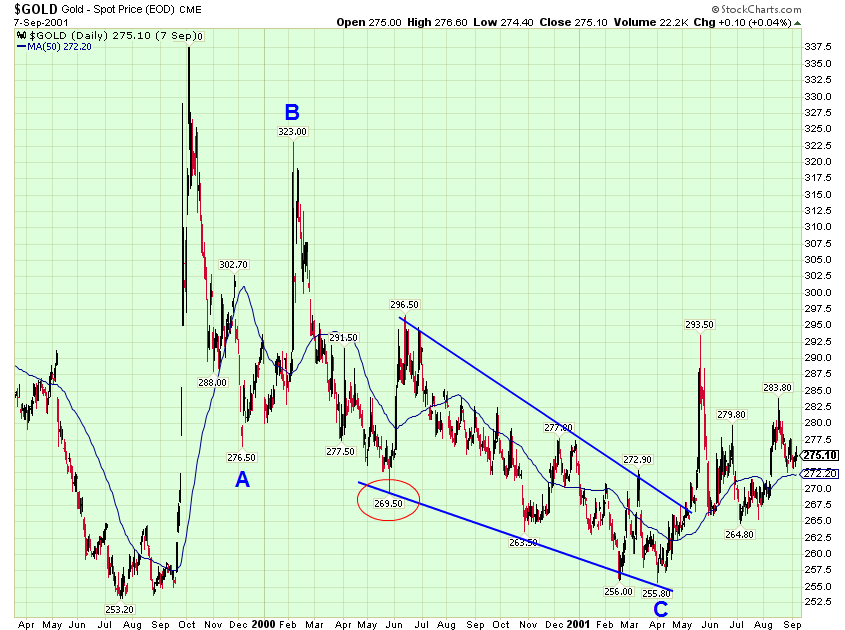
 Here is gold 1999-2001 if you do not believe that it can rally for 2-3 months and correct for 18 months with higher low:)
Back then USD was topping for 2 years. This time it should not last so long, but if the USD has one more high a correction A-B-C(to the red circle) for roughly 6 months is in the cards.
Here is gold 1999-2001 if you do not believe that it can rally for 2-3 months and correct for 18 months with higher low:)
Back then USD was topping for 2 years. This time it should not last so long, but if the USD has one more high a correction A-B-C(to the red circle) for roughly 6 months is in the cards.
 I am following this triangle for a few months and if it plays out we should see it finished in the first half of July.
The vertical lines again are 40 day cycle lows and we have four 20 week cycles. A finished triangle will be a 18 month cycle low and final rally for the USD should start.
I am following this triangle for a few months and if it plays out we should see it finished in the first half of July.
The vertical lines again are 40 day cycle lows and we have four 20 week cycles. A finished triangle will be a 18 month cycle low and final rally for the USD should start.
 This is one of the majors NEM, ABX has the same chart. If the count is right we should see more important low in September-October
 And GDXJ - if major gold miners make higher high, I am speculating that junior miners will make higher high too, but as a part of a bigger correction.


Mar 20, 2016
Weekly preview
Short term view - topping and than lower next week.
Intermediate term view - down and up for a few weeks before a bigger move lower.
Short term I was wrong this week. Obviously the move is stronger and it continued higher.
Intermediate term no change I expect shallow pullback another move higher, not sure at the moment higher or lower high, than a bigger correction lower.
I see a lot of comparison with the move in October 2015 and counting only three waves with imminent reversal. I think this is wrong, the current move is of a higher degree and I can not see three waves I see 5 waves on all indexes. I think the move higher is an impulse, market breadth have bullish behavior completely different than 10.2015, cycles we have an important low and only 5 weeks higher it is too early for reversal, TomDemark sequential for the first time in the last 18 months I see countdown/combo running with a change to be finished.
At the moment I think this the first leg higher and there will be one more after a correction.
Commodity sector - precious metals, crude oil, emerging markets EEM/EWZ with impulses higher so correction is expected soon and another leg higher.
TECHNICAL PICTURE
Short term - I am trying to see some corrective move but I see five waves higher consisting of 3 waves so it looks like diagonal to me.
The surprise will be if we see a higher high after a pullback. Than it is something much more bullish than expected.
Intermediate term - the same on the daily chart. All indicators are bullish and it will take time to reverse. That is why a pullback and test of the high.

Long term - added the bullish scenario.

MARKET BREADTH INDICATORS
The Market Breadth Indicators - no change since last week. Overbought for a while which means strength and it is typical for bullish moves. McClellan Oscillator shows divergences and some indicators are not following.
McClellan Oscillator - divergence.
McClellan Summation Index - buy signal, nearing overbought levels.
Weekly Stochastic of the Summation Index - buy signal, but at overbought territory. It is time for the next swing in the opposite direction.
Bullish Percentage - buy signal.
Percent of Stocks above MA50 - very overbought levels last seen in 2013.
Fear Indicator VIX - pushing outside the lower BB... move higher expected(lower for stocks)
Advance-Decline Issues - moving lower from overbought levels. Does not confirm the last move higher.
NYSE New Highs-New Lows - near overbought levels. This move is different than 10.2015.
Percent of Stocks above MA200 - moved above 50. This move is different than 10.2015.
HURST CYCLES
Day 25 of the 40 day cycle. After a strong move usually we have M pattern and move lower in this case to finish the 40 day cycle.
Tom Demark SEQUENTIAL AND COUNTDOWN - this technique spots areas of exhaustion.
For the first time for a long time we have combo/countdown with a chance to be finished.
I have posted several times a monthly chart and comparison with 2000 and 2008. The correction so far takes exactly the same time and follows exactly same path up and down, but that is all with the similarities. In a bear market we see a steady move lower around 25% and weak rebound. The current move looks like trading in a range since 10.2014 with wild swing up and down. It does not look like a bear market it looks like a huge correction caused by the 9 year cycle which is working on it's bottom.
The previous 4 moves ended with retest of the high/low... I do not see why this time should be different.
EM - it looks like impulse with more to come. The same for crude oil.
Impulse for precious metals and gold miners. GDXJ one final high to finis v of 5 so careful time to take some profits.
Intermediate term view - down and up for a few weeks before a bigger move lower.
Short term I was wrong this week. Obviously the move is stronger and it continued higher.
Intermediate term no change I expect shallow pullback another move higher, not sure at the moment higher or lower high, than a bigger correction lower.
I see a lot of comparison with the move in October 2015 and counting only three waves with imminent reversal. I think this is wrong, the current move is of a higher degree and I can not see three waves I see 5 waves on all indexes. I think the move higher is an impulse, market breadth have bullish behavior completely different than 10.2015, cycles we have an important low and only 5 weeks higher it is too early for reversal, TomDemark sequential for the first time in the last 18 months I see countdown/combo running with a change to be finished.
At the moment I think this the first leg higher and there will be one more after a correction.
Commodity sector - precious metals, crude oil, emerging markets EEM/EWZ with impulses higher so correction is expected soon and another leg higher.
TECHNICAL PICTURE
Short term - I am trying to see some corrective move but I see five waves higher consisting of 3 waves so it looks like diagonal to me.
The surprise will be if we see a higher high after a pullback. Than it is something much more bullish than expected.

Intermediate term - the same on the daily chart. All indicators are bullish and it will take time to reverse. That is why a pullback and test of the high.

Long term - added the bullish scenario.

MARKET BREADTH INDICATORS
The Market Breadth Indicators - no change since last week. Overbought for a while which means strength and it is typical for bullish moves. McClellan Oscillator shows divergences and some indicators are not following.
McClellan Oscillator - divergence.
McClellan Summation Index - buy signal, nearing overbought levels.
Weekly Stochastic of the Summation Index - buy signal, but at overbought territory. It is time for the next swing in the opposite direction.
Bullish Percentage - buy signal.
Percent of Stocks above MA50 - very overbought levels last seen in 2013.
Fear Indicator VIX - pushing outside the lower BB... move higher expected(lower for stocks)
Advance-Decline Issues - moving lower from overbought levels. Does not confirm the last move higher.
NYSE New Highs-New Lows - near overbought levels. This move is different than 10.2015.
Percent of Stocks above MA200 - moved above 50. This move is different than 10.2015.
HURST CYCLES
Day 25 of the 40 day cycle. After a strong move usually we have M pattern and move lower in this case to finish the 40 day cycle.

Tom Demark SEQUENTIAL AND COUNTDOWN - this technique spots areas of exhaustion.
For the first time for a long time we have combo/countdown with a chance to be finished.

I have posted several times a monthly chart and comparison with 2000 and 2008. The correction so far takes exactly the same time and follows exactly same path up and down, but that is all with the similarities. In a bear market we see a steady move lower around 25% and weak rebound. The current move looks like trading in a range since 10.2014 with wild swing up and down. It does not look like a bear market it looks like a huge correction caused by the 9 year cycle which is working on it's bottom.
The previous 4 moves ended with retest of the high/low... I do not see why this time should be different.

EM - it looks like impulse with more to come. The same for crude oil.

Impulse for precious metals and gold miners. GDXJ one final high to finis v of 5 so careful time to take some profits.

Mar 13, 2016
Weekly preview
Short term view - the indexes should reverse next week.
Intermediate term view - this is just the first leg from a bigger move higher.
I posted this week two updates showing my idea for wave X and mentioned the alternate scenarios bearish and bullish.
We had the spike higher to finish 5 wave pattern from 24.02 and price hit MA200 on the daily charts. Now waiting to see if the price will reverse next week.
Short term the signs are for a pullback - market breadth at overbought levels for a while,resistance reached, MA200 hit, finished 5 wave pattern, 61,8% Fibo retracement(from ATH to the low). And as a note the risk USD/JPY pair did not follow the markets higher and move lower is expected.
Intermediate term - price, indicators, market breadth, cycles all have bullish behavior. I mean the signs are not for a single corrective leg which is finishing. For example McClellan Oscillator staying overbought for a long time, Percent of Stocks above MA50 hit 90% short term it is a red flag for a pullback, but intermediate term means strength to expect more to the upside.
So the signs are for a pullback and than continuation higher.
TECHNICAL PICTURE
Short term - the path for X wave is shown. We do not have a reversal sign, but if you dig deeper on the 10min chart the spike higher finished 5 waves, hit resistance and MA200(daily), MACD/RSI divergence - the signs are for a reversal on Monday.

Intermediate term - All three scenarios are shown. At the moment I do not see evidence for the bearish(red) scenario. I think it is X(yellow) or 5(green). Now waiting for a pullback to see how it will look like.

Long term - no change. The indicators look bullish and I do not see a sudden reversal on the horizon.

MARKET BREADTH INDICATORS
The Market Breadth Indicators - overbought for a while which means strength and it is typical for bullish moves. In a bear market a rally hits overbought level and reverses no hanging at overbought levels.
McClellan Oscillator - hit extremes, overbought for a few weeks now we have divergences.
McClellan Summation Index - buy signal.
Weekly Stochastic of the Summation Index - buy signal, but at overbought territory. It is time for the next swing in the opposite direction.
Bullish Percentage - buy signal.
Percent of Stocks above MA50 - buy signal, hit very overbought level almost 90%.
Fear Indicator VIX - higher low short term divergence.
Advance-Decline Issues - topping at overbought levels and short term divergence.
HURST CYCLES
Long term cycles - there is different scenarios and a lot of discussions. For me the low from February is important low from a higher degree either 40 week or 18 cycle low.
DJIA is the only index which made higher low and I will count the move at day 20 to be in sync with the other indexes. We should see a pullback lower to finish the first 20 day cycle from the 40 day cycle
Tom Demark SEQUENTIAL AND COUNTDOWN - this technique spots areas of exhaustion.
Sell setup finished, the price still moves higher and no price flip at the moment. This is a sign for a strength for me.
Intermediate term view - this is just the first leg from a bigger move higher.
I posted this week two updates showing my idea for wave X and mentioned the alternate scenarios bearish and bullish.
We had the spike higher to finish 5 wave pattern from 24.02 and price hit MA200 on the daily charts. Now waiting to see if the price will reverse next week.
Short term the signs are for a pullback - market breadth at overbought levels for a while,resistance reached, MA200 hit, finished 5 wave pattern, 61,8% Fibo retracement(from ATH to the low). And as a note the risk USD/JPY pair did not follow the markets higher and move lower is expected.
Intermediate term - price, indicators, market breadth, cycles all have bullish behavior. I mean the signs are not for a single corrective leg which is finishing. For example McClellan Oscillator staying overbought for a long time, Percent of Stocks above MA50 hit 90% short term it is a red flag for a pullback, but intermediate term means strength to expect more to the upside.
So the signs are for a pullback and than continuation higher.
TECHNICAL PICTURE
Short term - the path for X wave is shown. We do not have a reversal sign, but if you dig deeper on the 10min chart the spike higher finished 5 waves, hit resistance and MA200(daily), MACD/RSI divergence - the signs are for a reversal on Monday.

Intermediate term - All three scenarios are shown. At the moment I do not see evidence for the bearish(red) scenario. I think it is X(yellow) or 5(green). Now waiting for a pullback to see how it will look like.

Long term - no change. The indicators look bullish and I do not see a sudden reversal on the horizon.

MARKET BREADTH INDICATORS
The Market Breadth Indicators - overbought for a while which means strength and it is typical for bullish moves. In a bear market a rally hits overbought level and reverses no hanging at overbought levels.
McClellan Oscillator - hit extremes, overbought for a few weeks now we have divergences.
McClellan Summation Index - buy signal.
Weekly Stochastic of the Summation Index - buy signal, but at overbought territory. It is time for the next swing in the opposite direction.
Bullish Percentage - buy signal.
Percent of Stocks above MA50 - buy signal, hit very overbought level almost 90%.
Fear Indicator VIX - higher low short term divergence.
Advance-Decline Issues - topping at overbought levels and short term divergence.
HURST CYCLES
Long term cycles - there is different scenarios and a lot of discussions. For me the low from February is important low from a higher degree either 40 week or 18 cycle low.
DJIA is the only index which made higher low and I will count the move at day 20 to be in sync with the other indexes. We should see a pullback lower to finish the first 20 day cycle from the 40 day cycle

Tom Demark SEQUENTIAL AND COUNTDOWN - this technique spots areas of exhaustion.
Sell setup finished, the price still moves higher and no price flip at the moment. This is a sign for a strength for me.

Mar 9, 2016
Update
If the idea for wave X is right I expect it to take similar shape to the one shown on the chart. It should burn time so that traders forget about the pain from the two sell-offs and stop talking about bear market.
Very choppy price action... curious to see if it play out:))))
Short term I expect spike higher after the ECB meeting and reversal. Than lower to MA200 hourly until FOMC next week (20 day cycle low).
Than the resistance zone to be tested and March to finish green... I can not say with higher high or lower high before seeing how the moves before that develop.
April should start lower to finish wave B and 40 day cycle low than one more rally in May to finish X.
Fibo and support/resistance levels converge very nice, which is usually a sign that this is the right pattern.


Mar 7, 2016
Update
The indexes moved higher SP500 reached the resistance zone not a big surprise. So far we have two legs higher. On the chart are shown the two scenarios which I am talking for a while. This week should give us the answer.
My preferred scenario is that we have wave X (yellow) to correct the move down which begun last year and to reset the bearish sentiment.
Alternate scenarios if I am wrong:
The bearish scenario is we have single zig-zag "a-b-c" and "the bearish market" resumes - I do not see signs for that neither indicators nor cycles nor market breadth and three weeks are way too short to correct 9 months.
The bullish scenario - we should see the price continue higher and move substantially above resistance, to test it this time as support and new ATH for an impulse. The problem is market breadth is overbought and McClellan Oscillator at nose bleeding levels so another 100 points for wave 3 look problematic...


Subscribe to:
Posts (Atom)