Oct 27, 2018

Weekly preview

I have added charts below - for those who think we have a major top, correction has just begun, it is very bad third wave etc. I have a news for you the correction is not running for a few weeks it is running for 10 months already. Look at the charts below and look at SP500 no difference a-b-c in a channel but masked with higher high. I do no know how many times I have to explain it.....


I thought this b wave will take a few more days... I was fooled by this candle with huge shadow on Tuesday. No wonder this week we saw really crazy things 5-6 reversal 60-80 points each. At the end the pattern is overlapping crap, diagonal comes to my mind - wave c which should be done and we saw a reversal on Friday.

This move lower has all attributes of important intermediate term low. Since 2009(see cycle chart) this is the 8th sell off 10% or more. They all look the same - 5-6 weeks lower and most of the selling is concentrated in two weeks, on four occasions the low was tested one more time (2011/2015/2016/2018). Currently we have week 5 with 2 weeks selling... we will see a bottom soon(probably already done) statistically there is 50/50 chance the bottom will be tested. Looking at the indicators and market breadth which all point lower the probability is higher that we will see a retest. They need time to flatten and reverse.
Market breadth confirms it - we are seeing levels which are common for important intermediate term lows with serious selling pressure. Cycles - 18 month cycle low is expected. The wave pattern starts looking complete on many indexes not only in the US.
For me the signs are that we are at an intermediate term bottom and multi month move higher. Most likely we will see bottoming process first taking a few weeks, V shape bottom is less likely.


TECHNICAL PICTURE and ELLIOTT WAVES
Short term - overlapping mess probably diagonal. The important message - it is not an impulse. You can count a-b-c or 1-2-3-4-5(diagonal) it does not matter it smells like intermediate term low.
There is a slight chance to see one more low if you count the high on Tuesday as wave 4 and than a diagonal which needs one final low. The problem with this count is at the same time you count strength fifth wave extension and in the same time weakness diagonal.


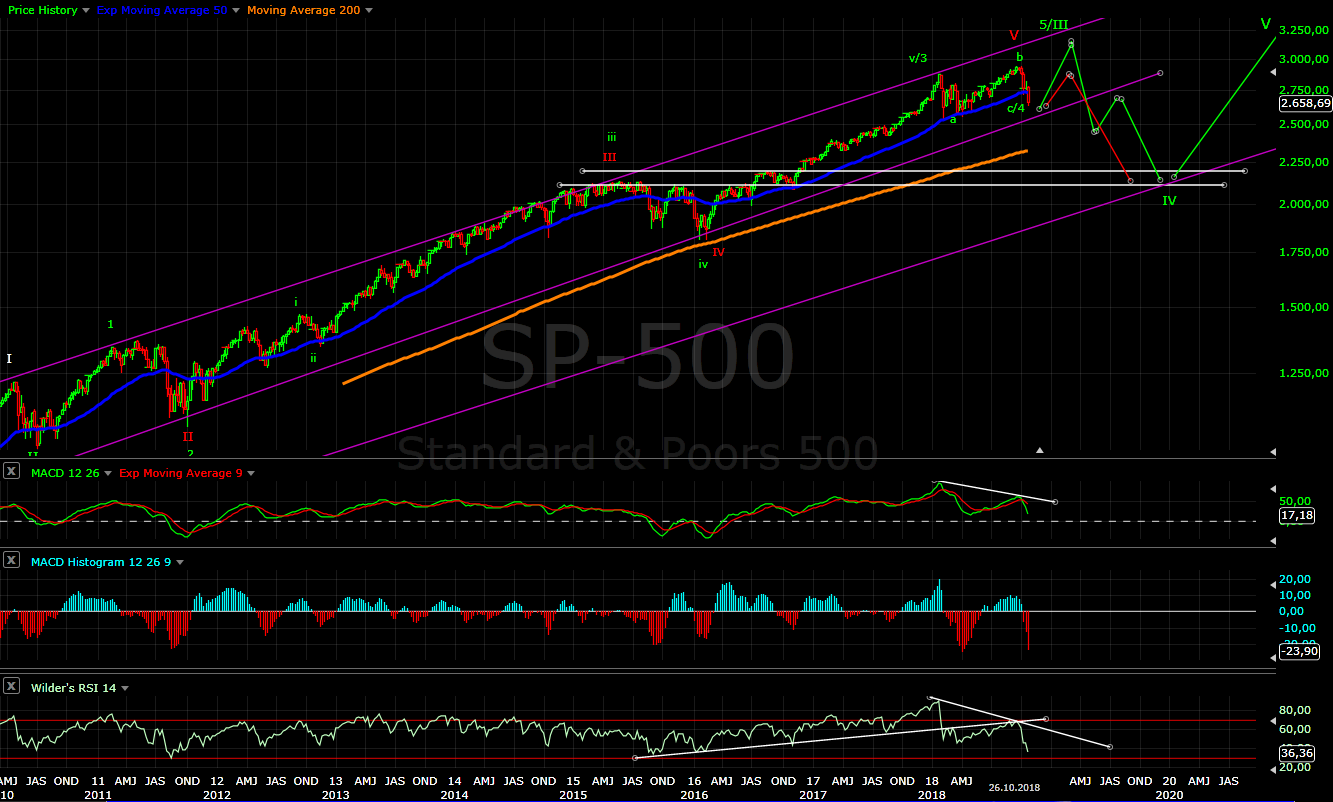
Intermediate term - the lower trend line was touched if you ignore the long shadows, this is ok with trend lines. What happens next? There is two options - one more ATH(green) or B(red) to the resistance zone. We will have enough time to decide which one it is... no need to choose now.


Long term - the same on the weekly chart - ATH(green) for the bullish scenario, H&S for the bearish(red).


MARKET BREADTH INDICATORS
Market Breadth Indicators - extreme levels common for important corrections and divergences. Interesting is on Wednesday we saw huge sell off and A/D issues and the McClellan Oscillator barely moved lower.... most likely only a few big names moved the indexes lower.
McClellan Oscillator - after extreme we have triple divergence.
McClellan Summation Index - sell signal, very deep dive since 2009 only in 2016 at 4/8 year cycle low we saw such deep move lower.
Weekly Stochastic of the Summation Index - sell signal, at oversold level, waiting to turn up.
Bullish Percentage - sell signal, only in 2011 and 2015 we saw lower levels.
Percent of Stocks above MA50 - another extreme with divergence.
Fear Indicator VIX - lower high and divergence.
Advance-Decline Issues - did not move lower after such fear and sell off.... strange my only explanation is a few big names dragged the market lower.


HURST CYCLES
Day 35 for the 40 day cycle, the indexes are close to a bottom or it was hit already.


Week 17 for the 20 week cycle.... it looks like 18 month cycle low to me.


I showed NYSE chart and explained why we have big correction and it is wave B up. Below the updated chart - I am "shocked" what happened. The worst what we can see is the expected test of the low in November to be a lower low, after that it is multi month rally up.


DAX exactly the same the indexes are synchronized at important highs an lows and at the end the pattern is the same.


Market breadth percent of stocks above MA50 - in a bull market it moves in overbought territory stays there for months and correction pushes back briefly to oversold level followed by quick move to overbought, in a bear market it is the opposite. What we have in January - April oversold for a few months push to the upper boundary failed despite the "strong rally" and plunged to oversold again. Classical indicator behavior.
What we have? - a-b-c Do you get it why I was explaining correction no 3200? Do you think I was wrong? I will dear to say I was right, than will some one explain me why this is not just wave C and it is something else?

Oct 20, 2018

Weekly preview

We have the bounce higher, but it feels more like b wave and not 4. You can count impulse with perfect Fibo measurements, the move higher retraced 50%, Demark setup lower has not been finished... for me this is not 4 but b is running already.
Whether b or 4 it does not matter for the big picture - expect one more low in a few weeks and higher for a few months.


TECHNICAL PICTURE and ELLIOTT WAVES
Short term - I think wave b is running and it will test resistance and the broken trend line around 2850.


Intermediate term - I expect 1-2 weeks bounce between MA50 and MA200 for wave b and one more sell off. For something really bearish(red) we should see a move below the trend line and new lows around 2500.


Long term - I can not see major top(V red), I think something more complicated is running either 4 of III or complex IV.


MARKET BREADTH INDICATORS
Market Breadth Indicators - trying to move up from oversold levels. I think we will see a small divergence and up (wave b) followed by a bigger divergence a few weeks later for an intermediate term low lasting a few months.
McClellan Oscillator - resetting after very oversold levels.
McClellan Summation Index - sell signal, heading for values below -500 which is typical for important intermediate term lows.
Weekly Stochastic of the Summation Index - sell signal, in oversold territory.
Bullish Percentage - sell signal, but strong so far, around levels for an intermediate term low.
Percent of Stocks above MA50 - bounce higher from very oversold level.
Fear Indicator VIX - pulling back after high levels close to 30. I expect another lower high followed by another higher low for multiple divergence.
Advance-Decline Issues - bounce higher from oversold level. I expect to see divergence before the indexes hit a low.


HURST CYCLES
Longer 20 week cycle expected, so most likely two longer 40 day cycles and the second one at day 29 with four 20 day cycles.


Week 16 of the 20 week cycle. I think we will see a few more weeks for 18 month cycle low, average length is 64-66 currently week 61.


Tom Demark SEQUENTIAL AND COUNTDOWN - this technique spots areas of exhaustion.
Interesting is we do not have finished setup despite the sell off, which makes me think we have wave b and not 4 running.

Oct 14, 2018

Weekly preview

The price was not responding to market breadth and US indexes looking like decoupled from the rest of the world.... and then for two days they caught up and price is at levels at which it is expected to be at the right time. My primary scenario was wave C lower and 18 month cycle low in October, but we saw continuation higher in September and I have started to doubt and consider the possibility of one more high.... then boom two day mini crash. I do not know how to predict them, but at least the tools tell me which is the right direction.

Now what to expect:
- short term the usual behavior when we see so much fear - strong bounce and test of the low. The pattern looks like an impulse so I expect lower low with divergences.
- intermediate term - we have a lot of fear Fear&Greed at 5(levels lower than February 2016 and 2018), market breadth is telling me to expect intermediate term low, RSI at 17, cycles at least 40 week low.... all this are signs to expect intermediate term low and multi month move higher.

What are the possible scenarios:
- the top is in, we have reversal and this is the first wave lower. In this case I expect to see corrective move higher in November... more likely until Christmas, the traders should forget the pain before continuation lower. This is the minimum which I expect, but I give it lower probability because bear markets usually start slowly and not with max fear to scare everybody for two days. This is typical for a bull market to purge greed after the traders getting too greedy.... do you remember the comments DJ 30k in 2017 and now?
- corrective structure a flat is finishing and one final high before a big correction - at the moment this is what I see from the charts. EW I have explained that I see corrective structure and you do not have a major top with wave B, cycles I think this is 18 month cycle low(more below), market breadth pointing to intermediate term low of higher magnitude, which will last for a while(months).


TECHNICAL PICTURE and ELLIOTT WAVES
Short term - I see 1-2-3 lower, now strong bounce from oversold levels and one final move lower to finish impulse. If we see continuation to 2800 we will have a-b-c hitting resistance with c=a and 50% retracement. 2800 is very strong resistance(see the chart below) the price has nothing to do above this level if we have more to the downside.


Intermediate term - RSI with extreme so expect bounce higher and lower low with divergence. After that I expect minimum the price to visit the 2800-2850 resistance area and RSI testing the trend lines. In November the indexes should move higher and we will see if the move is weak or strong and we will know what is going on if we have a reversal(red count V->1-2) or to expect new ATH(green A-B-C->V).


Long term - preferred scenarios is C wave for a flat correction(green). This is what my tools are telling me.


MARKET BREADTH INDICATORS
Market Breadth Indicators - oversold but need some time for bottoming and divergences. The levels and behavior are pointing to intermediate term low which should last for a while... months.
McClellan Oscillator - very oversold bounce and higher low expected.
McClellan Summation Index - it will reach -500 soon, expect important intermediate term low.
Weekly Stochastic of the Summation Index - in oversold territory, it should bottom in the next 1-2 weeks and turn higher.
Bullish Percentage - sell signal.
Percent of Stocks above MA50 - very oversold levels, bounce higher and higher low with divergences expected.
Fear Indicator VIX - too fast too high roughly 29, levels asociated with corrections of higher degree. Now it should make lower high and move lower making another higher low for multiple divergence.
Advance-Decline Issues - in oversold level.... it should stay there for a while and we should see at least one more low.


HURST CYCLES
I was following a cycle model for a long time which was expecting 18 month cycle low in October, but price was refusing to move lower. In September the market continued higher when it should have been topping and heading lower.... and I threw the towel:) switching to alternate model.
With the current price action the price is where it should be at the expected time.... how two days can make a difference.
I switched back to my cyclical model with 18 month cycle low in October expected in the next 1-2 weeks. At the moment it looks like we will see a bottom above the Feb-April lows which means low above the previous 40 week and 18 month cycle lows and according to the cycle theory the next 18 month cycle should make higher high.
The longer term cycle 4 year are influencing the shorter cycle 18 month cycle. Here is how the cycles with different length interact - the first cycle very strong, the second one starting strong and the second half sideway move, the third one should make higher high(the previous one making higher lows) in the first 1/3 of the cycle and then it should drop below the January low.


Day 24 or 42 depending how you count 2 or 3 daily cycles. In both cases we should see a low in the next 1-2 weeks.


Week 15 for the 20 week cycle, it is already mature and in the time window for a low.


SOX something to think about (BA from DJI index has the same chart) - why I am considering the possibility that we have only wave III from 2009 and the current pattern(2018) some kind of correction.
You can count finished impulse 1-2-3-4-5 from 2009 and in this case for a reversal you need impulse lower for confirmation. This means another two months lower to finish 3-4-5 at the moment it is only a-b-c....
I see long sideway move and the indicators resetting - MACD back from the moon to Earth(zero). I think it counts better as 4 and 5 to finish III and it fits perfect with cycles 4 year cycle highs and lows.

Oct 6, 2018

Weekly preview

The price action this week is not surprising, say bye bye melt up and SPX at 3200. It was so obvious even for a newbie just looking at the RSI... of course most of the traders for in love and did not want to see it for what it is. Relentless melt up is the third wave this is in the past 2017 now it is 2018.

Apart from that nothing new to add the same analysis wave 3 or B. I can not say for sure which one until I see how the move lower develops. The odds are higher that we saw the top of wave 3 and 4 is running. Why? - because this "plunge" occurs above MA50 and because of market breadth and especially the McClellan indicators. They are in corrective mode since the beginning of September 5-6 weeks already and price is following at the late stages when we should start looking for a bottom. Such price action is typical for a correction. The 20 week cycle is already at week 14 and a low is expected in the next few weeks. The market is narrow only a few shares holding it up and this shares will look better with a correction and one more high example - BA , UNH , AAPL for DJ and AAPL,AMZN,MSFT for the tech stocks.
Reversal and wave B is of course possible, but it has lower probability and I need to see a confirmation first - the price moving fast lower with impulse below 2800 in the next 2-3 weeks when a low is expected.


TECHNICAL PICTURE and ELLIOTT WAVES
Short term - DJ hit its target the trend line, SP500 did not... I do not know do we have finished ED or some choppy corrective pattern... it is not important.
At the moment I think we will see a bounce higher above 2900 to test MA50 and another leg lower with the same size to hit the lower trend line. For something more bearish(wave B running) the price has to move decisively below the trend line and support.


Intermediate term - all indicators look bearish, so I do not think it will just reverse higher... we should see continuation next week to finish at least corrective zig-zag. RSI was signaling very clear what is happening, the trend lines working perfect as usual... if you do not want to listen or do not know how to listen... well it is your problem the market was sending clear message.


Long term - bearish indicators with divergences too, but one more high could not be excluded... just waiting to see what the market will do.


MARKET BREADTH INDICATORS
The Market Breadth Indicators - price is following now.... usually when market breadth is in a sell mode for a while and price follows in later stages this is only a correction. More interesting is the big picture - AD cumulative is reacting very strong lower to a simple pullback. Only Brexit and the January sell off showed such weakness. I think we will see the missing AD divergence which usually signals an important top.
McClellan Oscillator - below zero since the beginning of September and mildly oversold, expect a move higher.
McClellan Summation Index - sell signal nearing the zero line.
Weekly Stochastic of the Summation Index - sell signal.
Bullish Percentage - sell signal.
Percent of Stocks above MA50 - in the middle of the range, move to the oversold level 25 would be nice for a finished correction.
Fear Indicator VIX - not a surprise divergences and higher. I expect to see one more higher low before important top.
Advance-Decline Issues - plunging lower heading for the oversold zone.


HURST CYCLES
Day 37, but as I wrote the last two weeks three shorter cycles and day 19(yellow) will look better. It does not matter, in both cases we should see at least one more week lower for a correction.

Week 14 for the 20 week cycle, it is not a surprise that price turned lower instead of "melting up". It is time for 20 week cycle high(check) and a few weeks lower.