
Jun 30, 2014
Update
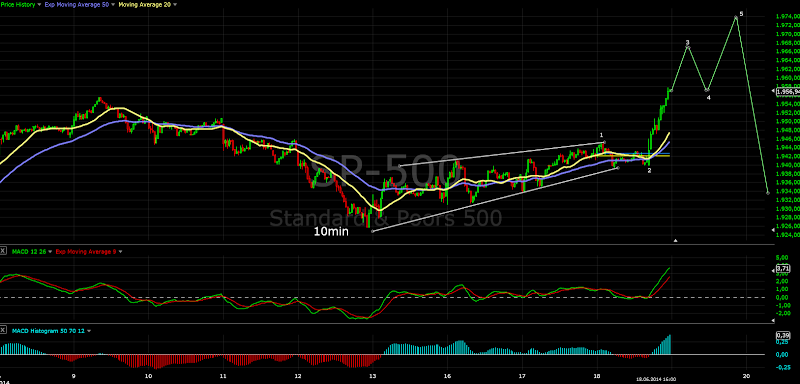
Wave B could be over, nice risk reward for short term term traders with stop above the high for the day.
Clear 3 wave structure with a=c and 5 waves finished for c of B... it is worth the risk 3-4 points if you are short term trader.

Jun 29, 2014
Weekly review
Short term view - green Monday, on Tuesday the second leg down should begin
Intermediate term view - pullback is running... probably another week or max two. Just the next dip to buy.
Ok as expected final push higher and something to the downside begun. The SP500 is of course the strongest index, we saw only 20 points drop:)
Choppy week, nothing has really changed. EW - I think this should be a wave 4, Cycles - one or two weeks to finish a pullback for 20 week cycle low, Indicators - we saw divergences and they are reseting from overbought levels.
Looking at the DAX and the US indexes on Friday I think the first leg of the pullback is over now we should be in wave B up. Add to this that Monday is the end of the quarter...
Based on the weak action for the first leg down the target for the second is the trend line and support around 1930 (see the first chart).
Trading - I do not know if it is worth to chase 20-30 points against the trend. This is wave 4 which means shallow and choppy move against the trend (that is what we see). It is much smarter to spot the low of the pullback and add to long position.
I will try to post as soon as possible if I see something like the end of wave B and the beginning of the next leg lower.... if some one is interested:) but do not short SP500 find the weakest index, DJ is better for example.
TECHNICAL PICTURE
Short term - the trend line looks like the obvious target for this pullback....

Intermediate term - no change, we have a wedge and in EW terms this should be wave 4.

Long term - I do not think that any move higher will clear the MACD divergence and start another long lasting rally. I think the next big move will be lower, but it could last months until we reach this point. Do not fall asleep, double MACD divergence on the weekly chart means expect something nasty...

MARKET BREADTH INDICATORS
The Market Breadth Indicators - are saying we are near to a top... that does not mean the indexes should reverse tomorrow. It is perfectly acceptable to see a pullback and higher high through the summer. It means do not expect huge rally rather a weak one before a reversal.
McClellan Oscillator - moved above the zero line.
McClellan Summation Index - buy signal, but still lower high and divergence.
Weekly Stochastic of the Summation Index - buy signal, but in overbought territory... the swing higher is topping?
Bullish Percentage - buy signal.
Percent of Stocks above MA50 - dropped a little bit but still strong.
Fear Indicator VIX - complacency is very high, the BB are getting very narrow...
Advance-Decline Issues - do not confirm the move higher, another lower high. Obviously fewer and fewer stocks are moving higher.
Put/Call ratio - crazy levels, everybody bullish buying calls....
HURST CYCLES
The cycles will look much better if the indexes finish the pullback as expected. The other possibility is I am wrong and the low is behind us.
The cycles do not give us an edge at the moment, we will wait for a while and see what happens.
Tom Demark SEQUENTIAL AND COUNTDOWN - this technique spots areas of exhaustion.
Nothing interesting after a choppy week..... only a price flip on the daily chart.
Intermediate term view - pullback is running... probably another week or max two. Just the next dip to buy.
Ok as expected final push higher and something to the downside begun. The SP500 is of course the strongest index, we saw only 20 points drop:)
Choppy week, nothing has really changed. EW - I think this should be a wave 4, Cycles - one or two weeks to finish a pullback for 20 week cycle low, Indicators - we saw divergences and they are reseting from overbought levels.
Looking at the DAX and the US indexes on Friday I think the first leg of the pullback is over now we should be in wave B up. Add to this that Monday is the end of the quarter...
Based on the weak action for the first leg down the target for the second is the trend line and support around 1930 (see the first chart).
Trading - I do not know if it is worth to chase 20-30 points against the trend. This is wave 4 which means shallow and choppy move against the trend (that is what we see). It is much smarter to spot the low of the pullback and add to long position.
I will try to post as soon as possible if I see something like the end of wave B and the beginning of the next leg lower.... if some one is interested:) but do not short SP500 find the weakest index, DJ is better for example.
TECHNICAL PICTURE
Short term - the trend line looks like the obvious target for this pullback....

Intermediate term - no change, we have a wedge and in EW terms this should be wave 4.

Long term - I do not think that any move higher will clear the MACD divergence and start another long lasting rally. I think the next big move will be lower, but it could last months until we reach this point. Do not fall asleep, double MACD divergence on the weekly chart means expect something nasty...

MARKET BREADTH INDICATORS
The Market Breadth Indicators - are saying we are near to a top... that does not mean the indexes should reverse tomorrow. It is perfectly acceptable to see a pullback and higher high through the summer. It means do not expect huge rally rather a weak one before a reversal.
McClellan Oscillator - moved above the zero line.
McClellan Summation Index - buy signal, but still lower high and divergence.
Weekly Stochastic of the Summation Index - buy signal, but in overbought territory... the swing higher is topping?
Bullish Percentage - buy signal.
Percent of Stocks above MA50 - dropped a little bit but still strong.
Fear Indicator VIX - complacency is very high, the BB are getting very narrow...
Advance-Decline Issues - do not confirm the move higher, another lower high. Obviously fewer and fewer stocks are moving higher.
Put/Call ratio - crazy levels, everybody bullish buying calls....
HURST CYCLES
The cycles will look much better if the indexes finish the pullback as expected. The other possibility is I am wrong and the low is behind us.

The cycles do not give us an edge at the moment, we will wait for a while and see what happens.

Tom Demark SEQUENTIAL AND COUNTDOWN - this technique spots areas of exhaustion.
Nothing interesting after a choppy week..... only a price flip on the daily chart.

Jun 24, 2014
Update
Update of the chart which I have posted several days ago... closer look of the SP500 index. It is following the plan and one small final push is missing.
It is difficult to say if 4 is over, if this is the case the indexes should open higher.
Watch out if the price moves bellow 1952 - the last minor low and MA50 on the hourly chart.


Jun 22, 2014
Weekly review
Short term view - another pullback lower expected.
Intermediate term view - when the short term moves finish I expect a correction to around 1900.
I was expecting a little bit more to the downside to finish 20 week cycle... well we saw only three red days and new marginal high as expected.
I still think that the indexes are following scenario 2 from the post Statistic.
We saw strength, profit taking and now we are seeing higher high with divergences MACD daily, RSI again above 70.
The short term picture is not very clear, but I think the indexes are topping than we should see a move to around 1900. Move bellow 1952 will confirm that something to the downside has begun.
TECHNICAL PICTURE
Short term - I expect one final push higher before a drop to the trend line.... than test of the highs again.

Intermediate term - it looks like a wedge to me and wave 4 to 1900 should follow. The upper wedge line is tested for the second time with MACD divergence and RSI moved above 70 again. I do not think that it is time to buy.

Long term - I do not think that any move higher will clear the MACD divergence and start another long lasting rally. I think the next big move will be lower, but it could last months until we reach this point. Do not fall asleep, double MACD divergence on the weekly chart means expect something nasty...

MARKET BREADTH INDICATORS
The Market Breadth Indicators - starting to show divergences and hit overbought levels.
McClellan Oscillator - lower high and divergence.
McClellan Summation Index - buy signal, but still lower high and divergence.
Weekly Stochastic of the Summation Index - buy signal, but in overbought territory... the swing is topping?
Bullish Percentage - buy signal, but at levels where you see a top.
Percent of Stocks above MA50 - in overbought territory.
Fear Indicator VIX - at extreme low again
Advance-Decline Issues - do not confirm the move higher, another lower high. Obviously fewer and fewer stocks are moving higher.
Put/Call ratio - crazy levels, everybody bullish....
HURST CYCLES
The cycles are not very clear at the moment. One possibility is that we saw 20 week cycle low at day 42... but only three red days and 200 points... The other possibility is that a move lower to 1900 starts soon than such low will look much better for a 20 week cycle low.
The cycles do not give us an edge at the moment, we will wait for a while and see what happens.
Tom Demark SEQUENTIAL AND COUNTDOWN - this technique spots areas of exhaustion.
Combo on the daily chart and sell setup on the weekly chart have been finished as expected.
The problem with Tom Demark Sequential looking for an exhaustion and market on steroids is that it did not work many times just look at the weekly chart. That is not a normal market 30 months without normal 10% correction.
Sell setup finished but without a price flip there is nothing to sell:)
Intermediate term view - when the short term moves finish I expect a correction to around 1900.
I was expecting a little bit more to the downside to finish 20 week cycle... well we saw only three red days and new marginal high as expected.
I still think that the indexes are following scenario 2 from the post Statistic.
We saw strength, profit taking and now we are seeing higher high with divergences MACD daily, RSI again above 70.
The short term picture is not very clear, but I think the indexes are topping than we should see a move to around 1900. Move bellow 1952 will confirm that something to the downside has begun.
TECHNICAL PICTURE
Short term - I expect one final push higher before a drop to the trend line.... than test of the highs again.

Intermediate term - it looks like a wedge to me and wave 4 to 1900 should follow. The upper wedge line is tested for the second time with MACD divergence and RSI moved above 70 again. I do not think that it is time to buy.

Long term - I do not think that any move higher will clear the MACD divergence and start another long lasting rally. I think the next big move will be lower, but it could last months until we reach this point. Do not fall asleep, double MACD divergence on the weekly chart means expect something nasty...

MARKET BREADTH INDICATORS
The Market Breadth Indicators - starting to show divergences and hit overbought levels.
McClellan Oscillator - lower high and divergence.
McClellan Summation Index - buy signal, but still lower high and divergence.
Weekly Stochastic of the Summation Index - buy signal, but in overbought territory... the swing is topping?
Bullish Percentage - buy signal, but at levels where you see a top.
Percent of Stocks above MA50 - in overbought territory.
Fear Indicator VIX - at extreme low again
Advance-Decline Issues - do not confirm the move higher, another lower high. Obviously fewer and fewer stocks are moving higher.
Put/Call ratio - crazy levels, everybody bullish....
HURST CYCLES
The cycles are not very clear at the moment. One possibility is that we saw 20 week cycle low at day 42... but only three red days and 200 points... The other possibility is that a move lower to 1900 starts soon than such low will look much better for a 20 week cycle low.

The cycles do not give us an edge at the moment, we will wait for a while and see what happens.

Tom Demark SEQUENTIAL AND COUNTDOWN - this technique spots areas of exhaustion.
Combo on the daily chart and sell setup on the weekly chart have been finished as expected.
The problem with Tom Demark Sequential looking for an exhaustion and market on steroids is that it did not work many times just look at the weekly chart. That is not a normal market 30 months without normal 10% correction.

Sell setup finished but without a price flip there is nothing to sell:)

Jun 19, 2014
Update
The short term picture changed a little bit, but the plan stays the same. After such a choppy move I thought we will see first lower low before the new highs... obviously not.
The plan is the same - short term top on strength,profit taking and another higher high followed by a correction.
The target seems to be 1975 for the upside. Everybody are expecting 2000 I think they will be disappointed:) we will see 2000 but later in the summer.
 The explanation for a blast from such ugly move is - 1 for Leading diagonal and now we are in wave 3. Bellow are the ideal projections for wave 3,4 and 5.


Jun 17, 2014
Update
Crawling higher before FOMC as expected. It is weak and choppy, it looks like a bear flag... or B wave. The plan is the same - FOMC should be a short term top and final wave lower to 1910. We will know soon if I am rigth.


Jun 14, 2014
Weekly review
Short term view - more downside expected to finish this move lower.
Intermediate term view - when the short term moves finish I expect a correction for 2-3 weeks.
My assumption that we saw an exhaustion was right... no RSI and the statistic was right:) Now you know that the index can move lower too:)))
Current thoughts:
- the move lower is corrective, but it does not look finished.
- FOMC 18.06... expect a bottom or a top for some of the short term moves from the first chart. I do not know, we will see how fast the indexes are moving on Monday/Tuesday
- RSI hitting overbought level usually means two things - strength and expect profit taking. We saw exactly this... Strength means the top will be tested or exceeded. See the post Statistic and the marks "2" - the reversal comes a little bit later and not when we see overbought levels.
Based on this observation my best guess projection is shown on the first chart. I think we saw wave A down, currently B is running(top FOMC?) and wave C lower should follow(bottom FOMC? if the indexes move very fast)
RSI statistic and the corrective structure to the downside argue that after that we should see a marginal new high before intermediate term correction.
TECHNICAL PICTURE
Short term - the short term is difficult to predict especially corrective moves... so you should follow closely the price action next week if you want to trade. At the moment I think the move will look perfect if we see one more leg lower to 1910 - the trend line, 50% Fibo, A=C.

Intermediate term - no change... correction to the trend line and support expected.

Long term - I do not think that any move higher will clear the MACD divergence and start another long lasting rally. I think the next big move will be lower, but it could last months until we reach this point.
Do not fall asleep, double MACD divergence on the weekly chart means expect something nasty...
MARKET BREADTH INDICATORS
The Market Breadth Indicators - still on buy, but look tired... intermediate term top is near as I expect?
McClellan Oscillator - moved bellow zero...
McClellan Summation Index - buy signal, but turned lower. Still lower high.
Weekly Stochastic of the Summation Index - buy signal, but reached overbought territory - time for an intermediate term top?
Bullish Percentage - buy signal, but with long term divergences.
Percent of Stocks above MA50 - pulled back from overbought territory...
Fear Indicator VIX - jumped higher from very low level...
Advance-Decline Issues - very weak since the last top.... the indexes are moving higher but the advancing issues can not move to overbought territory.
HURST CYCLES
Day 43 there is high probability that we saw the top of the 40 and 80 day cycle.
Waiting for a correction to finish the 20 week cycle.... The cycle will be right translated that is why I do not expect an important top rather a new high after the low.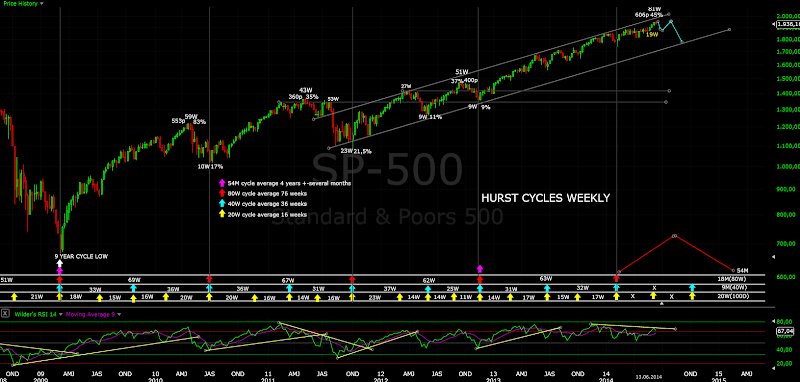
Tom Demark SEQUENTIAL AND COUNTDOWN - this technique spots areas of exhaustion.
The combo and sell setup on the weekly chart (almost finished) say we should expect correction soon. Marginal new high will fit perfect.
Very high probability that the sell setup will be finished.
Intermediate term view - when the short term moves finish I expect a correction for 2-3 weeks.
My assumption that we saw an exhaustion was right... no RSI and the statistic was right:) Now you know that the index can move lower too:)))
Current thoughts:
- the move lower is corrective, but it does not look finished.
- FOMC 18.06... expect a bottom or a top for some of the short term moves from the first chart. I do not know, we will see how fast the indexes are moving on Monday/Tuesday
- RSI hitting overbought level usually means two things - strength and expect profit taking. We saw exactly this... Strength means the top will be tested or exceeded. See the post Statistic and the marks "2" - the reversal comes a little bit later and not when we see overbought levels.
Based on this observation my best guess projection is shown on the first chart. I think we saw wave A down, currently B is running(top FOMC?) and wave C lower should follow(bottom FOMC? if the indexes move very fast)
RSI statistic and the corrective structure to the downside argue that after that we should see a marginal new high before intermediate term correction.
TECHNICAL PICTURE
Short term - the short term is difficult to predict especially corrective moves... so you should follow closely the price action next week if you want to trade. At the moment I think the move will look perfect if we see one more leg lower to 1910 - the trend line, 50% Fibo, A=C.

Intermediate term - no change... correction to the trend line and support expected.

Long term - I do not think that any move higher will clear the MACD divergence and start another long lasting rally. I think the next big move will be lower, but it could last months until we reach this point.
Do not fall asleep, double MACD divergence on the weekly chart means expect something nasty...

MARKET BREADTH INDICATORS
The Market Breadth Indicators - still on buy, but look tired... intermediate term top is near as I expect?
McClellan Oscillator - moved bellow zero...
McClellan Summation Index - buy signal, but turned lower. Still lower high.
Weekly Stochastic of the Summation Index - buy signal, but reached overbought territory - time for an intermediate term top?
Bullish Percentage - buy signal, but with long term divergences.
Percent of Stocks above MA50 - pulled back from overbought territory...
Fear Indicator VIX - jumped higher from very low level...
Advance-Decline Issues - very weak since the last top.... the indexes are moving higher but the advancing issues can not move to overbought territory.
HURST CYCLES
Day 43 there is high probability that we saw the top of the 40 and 80 day cycle.

Waiting for a correction to finish the 20 week cycle.... The cycle will be right translated that is why I do not expect an important top rather a new high after the low.

Tom Demark SEQUENTIAL AND COUNTDOWN - this technique spots areas of exhaustion.
The combo and sell setup on the weekly chart (almost finished) say we should expect correction soon. Marginal new high will fit perfect.

Very high probability that the sell setup will be finished.

Jun 11, 2014
Update
It looks to me like one final wave is missing... I think the DAX reversed already....
After that we will see which scenario will play out - see the previous post.


Jun 8, 2014
Statistic
The market seems very strong a lot of emotions and euphoria again..... I am skeptical, I think it is strong only at first glance... but let us forget emotions and see
what the statistic says.
This is a chart of SP500 with RSI since the bottom in 10.2011 - the second leg of this bull market.
I think the market is overbought and the move last week was exhaustion. RSI seems to confirm this moving to 73(the highest levels for this period 75)
Vertical line - RSI exceeded 70 and entered overbought territory
Circle - RSI touched 70 overbought territory
I see two scenarios repeating:
1 - pause for several days, another move higher and a small pullback.
2 - correction follows in the next several days.
If we count only the vertical lines we have probabilities "scenario 1/scenario 2" - 30%/70%
If we count both we have probabilities "scenario 1/scenario 2" - 40%/60%
So we should watch for two scenarios:
- 30%/40% chance for a sideway move with low somewhere near to the 1920 area/MA50 hourly and another move higher probably 2000 before a pullback.
- 60%/70% chance for a short term top in the next several days and a pullback - target 1850-1860
P.S. The other interesting thing is every time when we see case 2 serious drop follows - 100% track record:)


Jun 7, 2014
Weekly review
Short term view - short term top expected... this time I could be right:)
Intermediate term view - waiting for the move to finish and a correction for 2-4 weeks.
No change.... wrong forecast again:) no small pullback even to MA50 on the hourly chart. But as I wrote the trading is easy - stay long until you see signs for a weakness. There were no such so there were no need to take any action.
The forecast stays the same I expect a top and a correction for 2-4 weeks with target max 1850-1860. It is time for a 20 week cycle low and one year cycle low which we see every year in June-July. The strength only confirms my plan that after a correction we should see a new high.
The market feels on steroids again, a lot of complacency VIX at the lowest level since 2007 before the top... but I think this time it is weaker less shares are participating and not all indexes are so strong, weekly MACD divergence are still saying we are working on the top.... nevertheless this is not THE TOP it is months away (as long we stay above 1850-1860).
Long term traders can now sit back, relax and enjoy the summer. Intermediate term traders will have some work in June chasing a correction and waiting for a bottom around the end of June early July.
Trading - the same story like last week. Stay long until you see a lower high or higher high with divergence.
The DAX (see the last chart)looks like it has finished the move higher and next week we should see a reversal. That is why I think you should look closely for a reversal next week in the US markets too.
TECHNICAL PICTURE
Short term - up is up until it changes... minor support and MA50 now at 1925.
 - Triple cross(EMA10 and EMA20 crossing EMA50) - short term trend is up.
Intermediate term - I think the ED has been busted but the plan stays the same pullback to MA50/support and another higher high.
 - Trend direction EMA50/MACD - intermediate term trend is up.
- Momentum Histogram/RSI - momentum is up.
Long term - I do not think that any move higher will clear the MACD divergence and start another long lasting rally. I think the next big move will be lower, but it could last months until we reach this point.
 - Trend direction EMA50/MACD - the long term trend is up - the price above MA50 and MACD above zero. The MACD divergence should make you worry, that the long term trend is nearing a top.
- Momentum Histogram/RSI - momentum is up.
MARKET BREADTH INDICATORS
The Market Breadth Indicators - are showing some strength which is good for the intermediate term and any top now should not be an important top, the long term indicators like McClellan Summation Index are still weak which is a warning for the long term.
McClellan Oscillator - made higher high.
McClellan Summation Index - buy signal, but could not really move strong higher. Still lower high.
Weekly Stochastic of the Summation Index - buy signal
Bullish Percentage - buy signal, but still long term divergences.
Percent of Stocks above MA50 - strength moving to 88.
Fear Indicator VIX - extreme complacency last seen in 2007 several months before the top.
Advance-Decline Issues - surprising, it can not move to the overbought zone and on Friday advancing issues moved even lower.
Put/Call ratio - at extreme again
Percent of Stocks above MA200 - moved higher but is stays in this range 60-75... surprisingly for almost vertical move and 81 weeks without a correction.
HURST CYCLES
Day 38 - the move is getting extended in time, but I still think that we should see the indexes moving lower soon towards the expected 40 day and 80 day cycle low.
Waiting for a correction to finish the 20 week cycle.... The cycle will be right translated that is why I do not expect an important top rather a new high after the low.
Tom Demark SEQUENTIAL AND COUNTDOWN - this technique spots areas of exhaustion.
The setup has been finished as expected. Wait for the combo to finish or a price flip before any shorts.
There is very high probability that the setup will finish even if the correction begin next week.
Here is how the DAX looks like...
Intermediate term view - waiting for the move to finish and a correction for 2-4 weeks.
No change.... wrong forecast again:) no small pullback even to MA50 on the hourly chart. But as I wrote the trading is easy - stay long until you see signs for a weakness. There were no such so there were no need to take any action.
The forecast stays the same I expect a top and a correction for 2-4 weeks with target max 1850-1860. It is time for a 20 week cycle low and one year cycle low which we see every year in June-July. The strength only confirms my plan that after a correction we should see a new high.
The market feels on steroids again, a lot of complacency VIX at the lowest level since 2007 before the top... but I think this time it is weaker less shares are participating and not all indexes are so strong, weekly MACD divergence are still saying we are working on the top.... nevertheless this is not THE TOP it is months away (as long we stay above 1850-1860).
Long term traders can now sit back, relax and enjoy the summer. Intermediate term traders will have some work in June chasing a correction and waiting for a bottom around the end of June early July.
Trading - the same story like last week. Stay long until you see a lower high or higher high with divergence.
The DAX (see the last chart)looks like it has finished the move higher and next week we should see a reversal. That is why I think you should look closely for a reversal next week in the US markets too.
TECHNICAL PICTURE
Short term - up is up until it changes... minor support and MA50 now at 1925.

Intermediate term - I think the ED has been busted but the plan stays the same pullback to MA50/support and another higher high.

- Momentum Histogram/RSI - momentum is up.
Long term - I do not think that any move higher will clear the MACD divergence and start another long lasting rally. I think the next big move will be lower, but it could last months until we reach this point.

- Momentum Histogram/RSI - momentum is up.
MARKET BREADTH INDICATORS
The Market Breadth Indicators - are showing some strength which is good for the intermediate term and any top now should not be an important top, the long term indicators like McClellan Summation Index are still weak which is a warning for the long term.
McClellan Oscillator - made higher high.
McClellan Summation Index - buy signal, but could not really move strong higher. Still lower high.
Weekly Stochastic of the Summation Index - buy signal
Bullish Percentage - buy signal, but still long term divergences.
Percent of Stocks above MA50 - strength moving to 88.
Fear Indicator VIX - extreme complacency last seen in 2007 several months before the top.
Advance-Decline Issues - surprising, it can not move to the overbought zone and on Friday advancing issues moved even lower.
Put/Call ratio - at extreme again
Percent of Stocks above MA200 - moved higher but is stays in this range 60-75... surprisingly for almost vertical move and 81 weeks without a correction.
HURST CYCLES
Day 38 - the move is getting extended in time, but I still think that we should see the indexes moving lower soon towards the expected 40 day and 80 day cycle low.

Waiting for a correction to finish the 20 week cycle.... The cycle will be right translated that is why I do not expect an important top rather a new high after the low.

Tom Demark SEQUENTIAL AND COUNTDOWN - this technique spots areas of exhaustion.
The setup has been finished as expected. Wait for the combo to finish or a price flip before any shorts.

There is very high probability that the setup will finish even if the correction begin next week.

Here is how the DAX looks like...

Jun 5, 2014
Update
The DAX finished the last 5 waves up(of smaller degree), touched 10000, touched the upper wedge trend line again and reversed. It think the DAX finished wave 3 of the ED and wave 4 has begun.
Watch out for possible reversal in the US Markets today or tomorrow after NFP. Last minor support and MA50 hourly at 1916.
Subscribe to:
Posts (Atom)