UPDATE: I have read now that it is Thanksgiving next week(I am in Europe i did not know:) that means the bullish scenario has much higher probability. It was the preferred scenario anyway.
Higher next week, pullback first half of December for a week or two and another move higher until 10-15th of January. Statistic and the charts point to the same outcome.
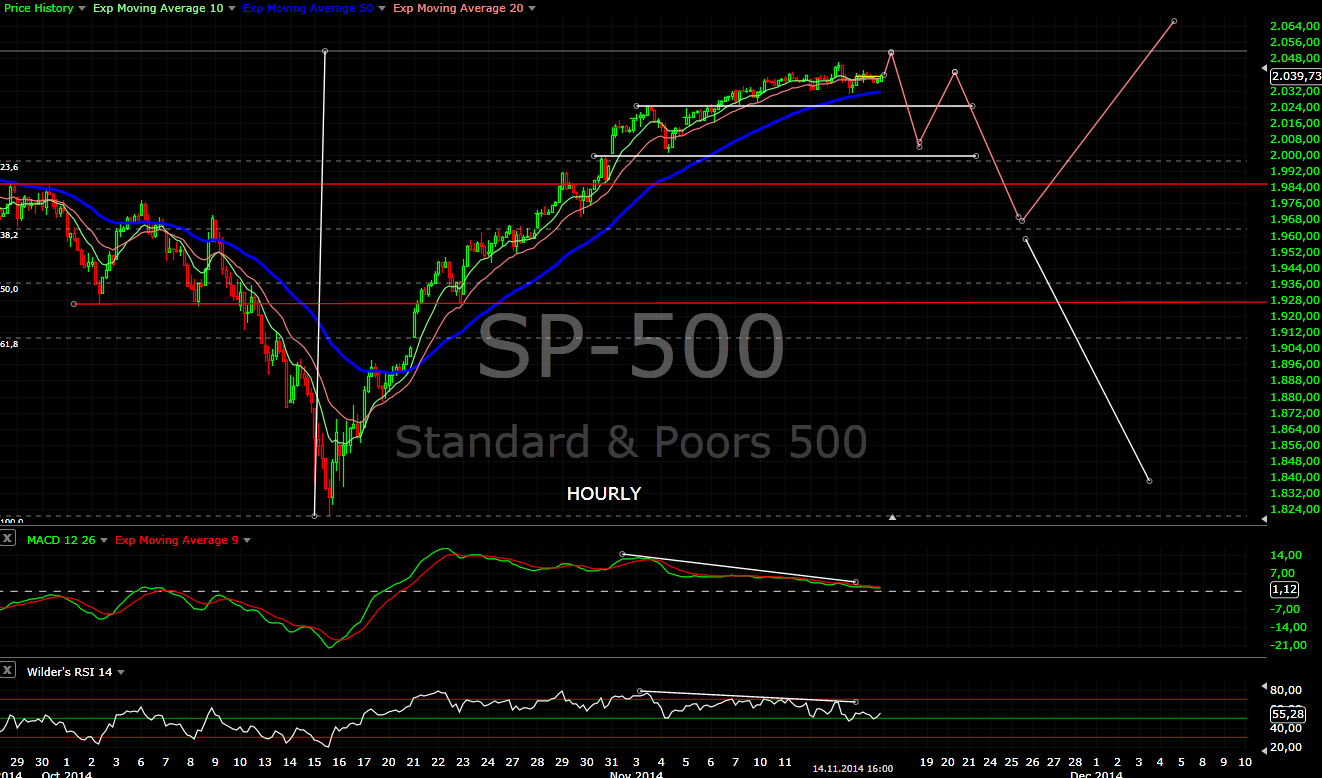
Short term view - not sure... I have to see what happens on Monday.
Intermediate term view - pullback after a short term top next week and another move higher.
So the central bankers produced a spike on Friday - perfect "natural" move since mid October with only one real red day.
BOC cutting rates, ECB will do what ever it takes, JOB are crazy anyway... Are they scared? When everything is so great why they need to "support" the economy/market all the time?
Usually I do not care about politics,economy etc. but I think the guys behind the curtain are getting nervous... the end game is approaching.
Back to the charts, first the short term - I wrote that I am not sure about the short term because looking at the the DAX and RUSSELL2000 charts I think one last move higher will look much better. They count much better and easier than DJ and SP500 and I will not be surprised if the major indexes print higher high too. Monday should give us the answer.
- the move on Friday looks like exhaustion gap and the spike was met with selling. That is perfect way for an end of the move up since mid October. This is the second chart where the bearish scenario is shown.
- one final spike to finish an impulse... you need an impulse to finish a move. This is the first chart the bullish scenario. I am leaning more toward this scenario, but we need confirmation on Monday.
The intermediate term scenario has not changed - October is behind us and November one week left... I do not think that we will see a major top in December. It sounds more realistic that we see a pullback to relief the overbought conditions/reset indicators and Christmas rally. Worst case even if this is the top, it will be retested before any serious sell off begins.
TECHNICAL PICTURE
Short term - the bullish scenarios one final wave higher to finish the move since since mid October.
The bearish scenario - you want to see the indexes open lower and "sink" like a rock to the support level 2040.
Intermediate term - no change.... waiting for a short term top and how the move lower will look like. Targets for the pullback the previous high and MA50
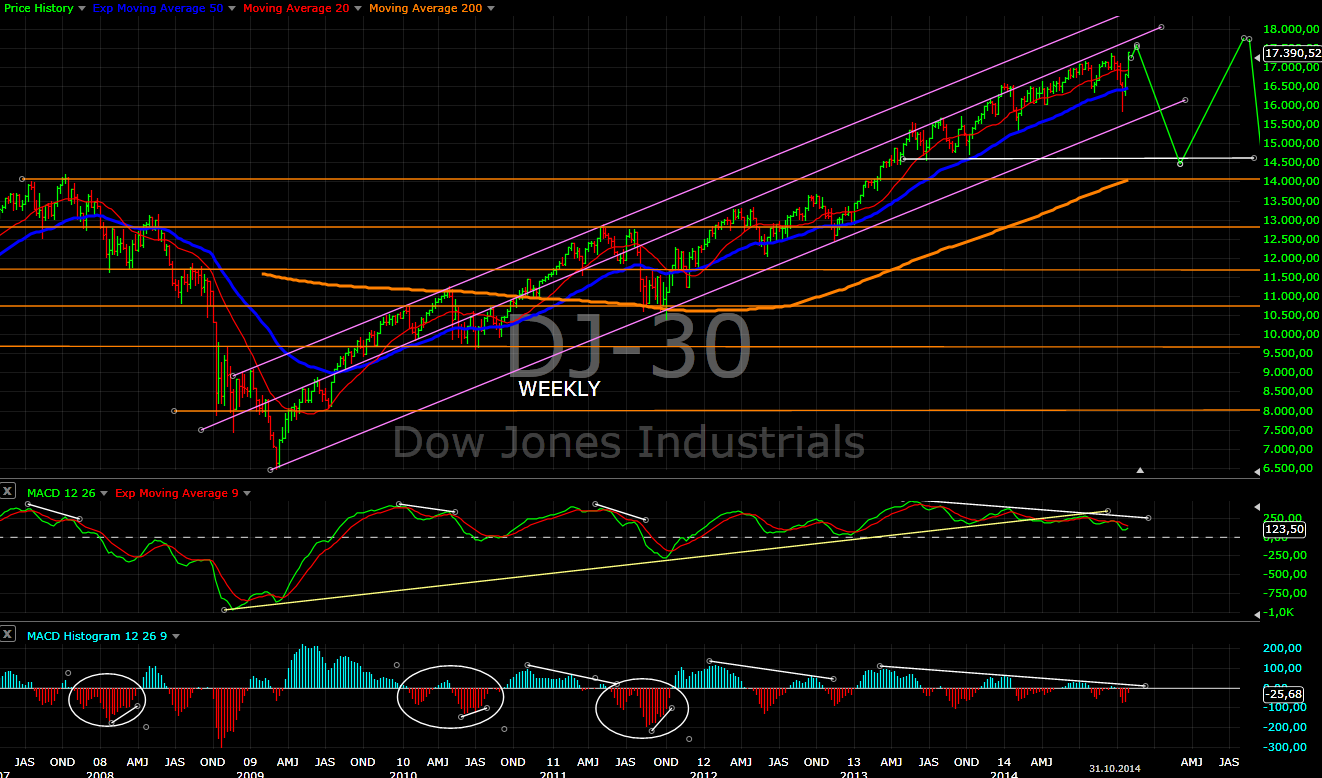
Long term - the long term picture is unchanged.
MARKET BREADTH INDICATORS
The Market Breadth Indicators - reaction lower after overbought conditions is due. No sell signals so this should be only a pullback.
McClellan Oscillator - divergence lower high.
McClellan Summation Index - buy signal.
Weekly Stochastic of the Summation Index - buy signal, but in overbought territory.
Bullish Percentage - buy signal.
Percent of Stocks above MA50 - buy signal, but at levels where usually we see a reaction lower.
Fear Indicator VIX - long term divergence.
Advance-Decline Issues - fewer stocks are advancing and the indicator is making lower high.
NYSE New Highs-New Lows - lower high after hitting overbought levels.
Percent of Stocks above MA200 - really a miserable levels for an all time highs.
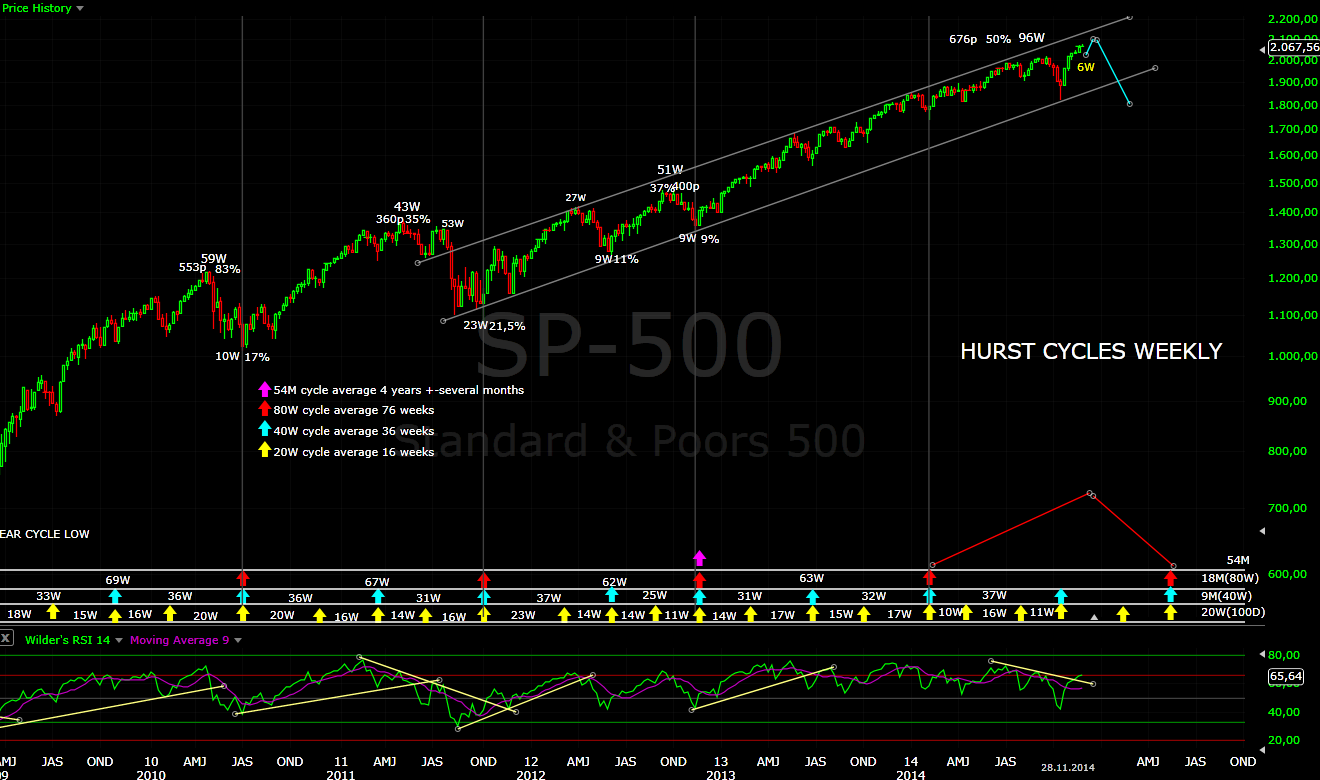
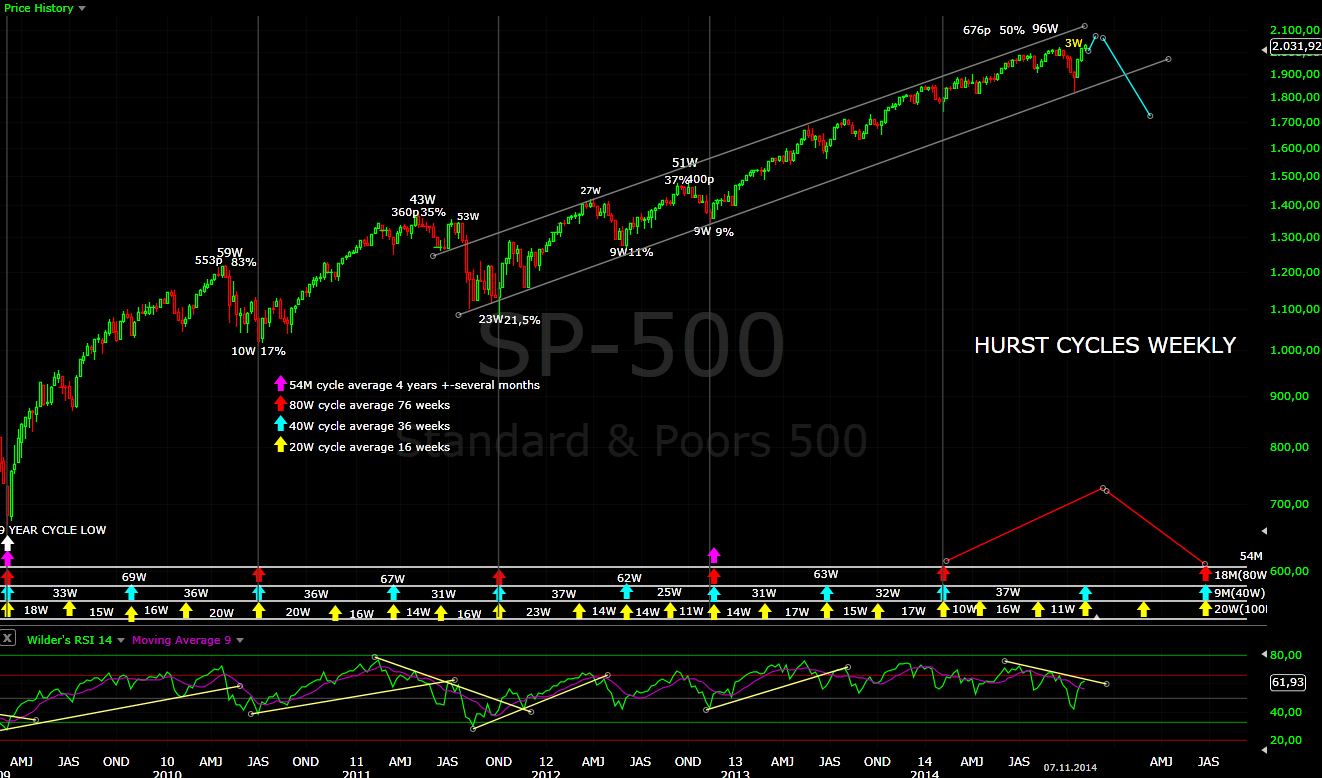
HURST CYCLES
Day 26 of the current 40 day cycle. I think next week we should see a short term top.
Week 5 of the current 20 week and 40 week cycle.
Tom Demark SEQUENTIAL AND COUNTDOWN - this technique spots areas of exhaustion.
Day 11 of a countdown. One more higher high to finish the countdown will look perfect.