Trading cycle - sell signal. It looks bad, but the analysis is not confirming it so I am just watching.

TECHNICAL PICTURE and ELLIOTT WAVES
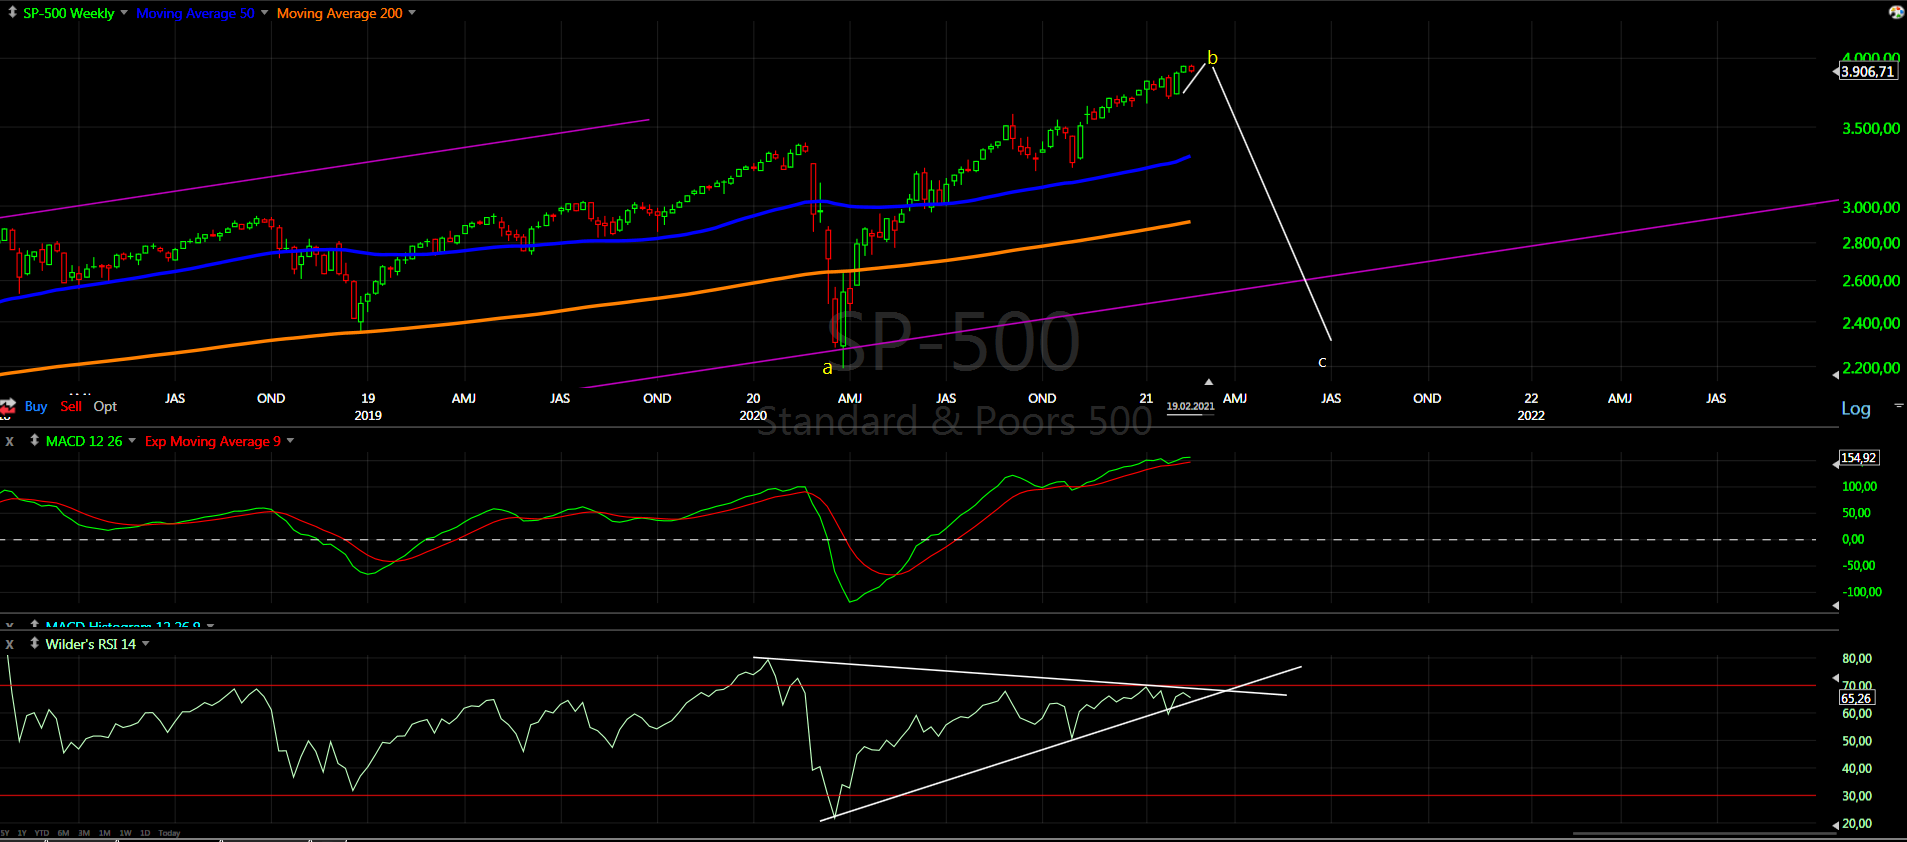
Short term - it looks like big zig-zag to me for the expected b/f-wave. It could start lower next week, but then it should reverse higher.

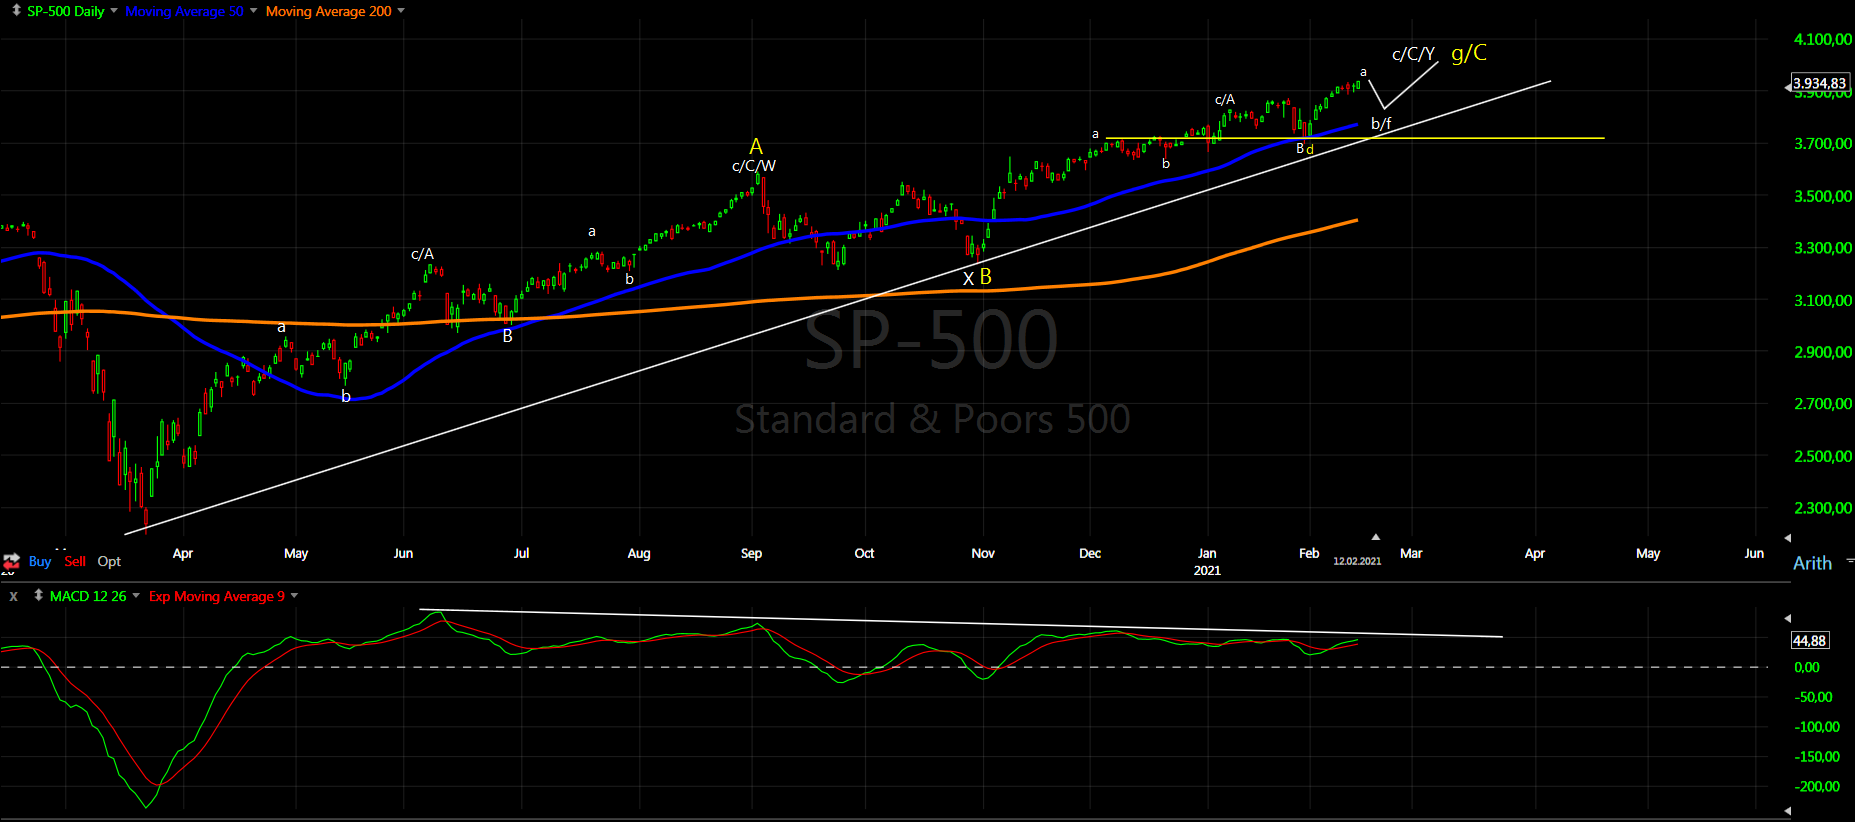
Intermediate term - I see one big zig-zag up. You can count it as W-X-Y(white) classic EW, but we do not have impulses. More likely series of zig-zags A-B-C(yellow) with the C-wave as a diametric.
The indicators with multiple divergences, waiting to see if MA50 will hold and confirm b/f-wave for one more push up.

Long term - the bull market completed in 2018. Since then a bunch of corrective waves. Currently I think this rally should be a corrective wave of a bigger pattern most likely triangle. Look at NDX we have corrective wave which is 1,618 bigger than the previous one which could be only b of a triangle. I think the best looking pattern is Neely's triangle.
MARKET BREADTH INDICATORS
Market Breadth Indicators - turned lower, which is not a surprise for a red week... so far there is no technical damages.
McClellan Oscillator - below zero.
McClellan Summation Index - sell signal.
Weekly Stochastic of the Summation Index - buy signal.
Bullish Percentage - pointing lower.
Percent of Stocks above MA50 - pointing lower.
Fear Indicator VIX - spike higher ... one more test of the low?
Advance-Decline Issues - still holding the trend line, no serious damages.
HURST CYCLES
Short term cycles - this week should be 5w low next is up for 5w high and we need one more 20d cycle higher to complete it.

Week 4 for the 20 week cycle. You can argue for the NDX... maybe SP500 that this is the 20 week low, but DJ and NYSE does not look like a low at all so I will stick to the count that we saw the 20 week low.
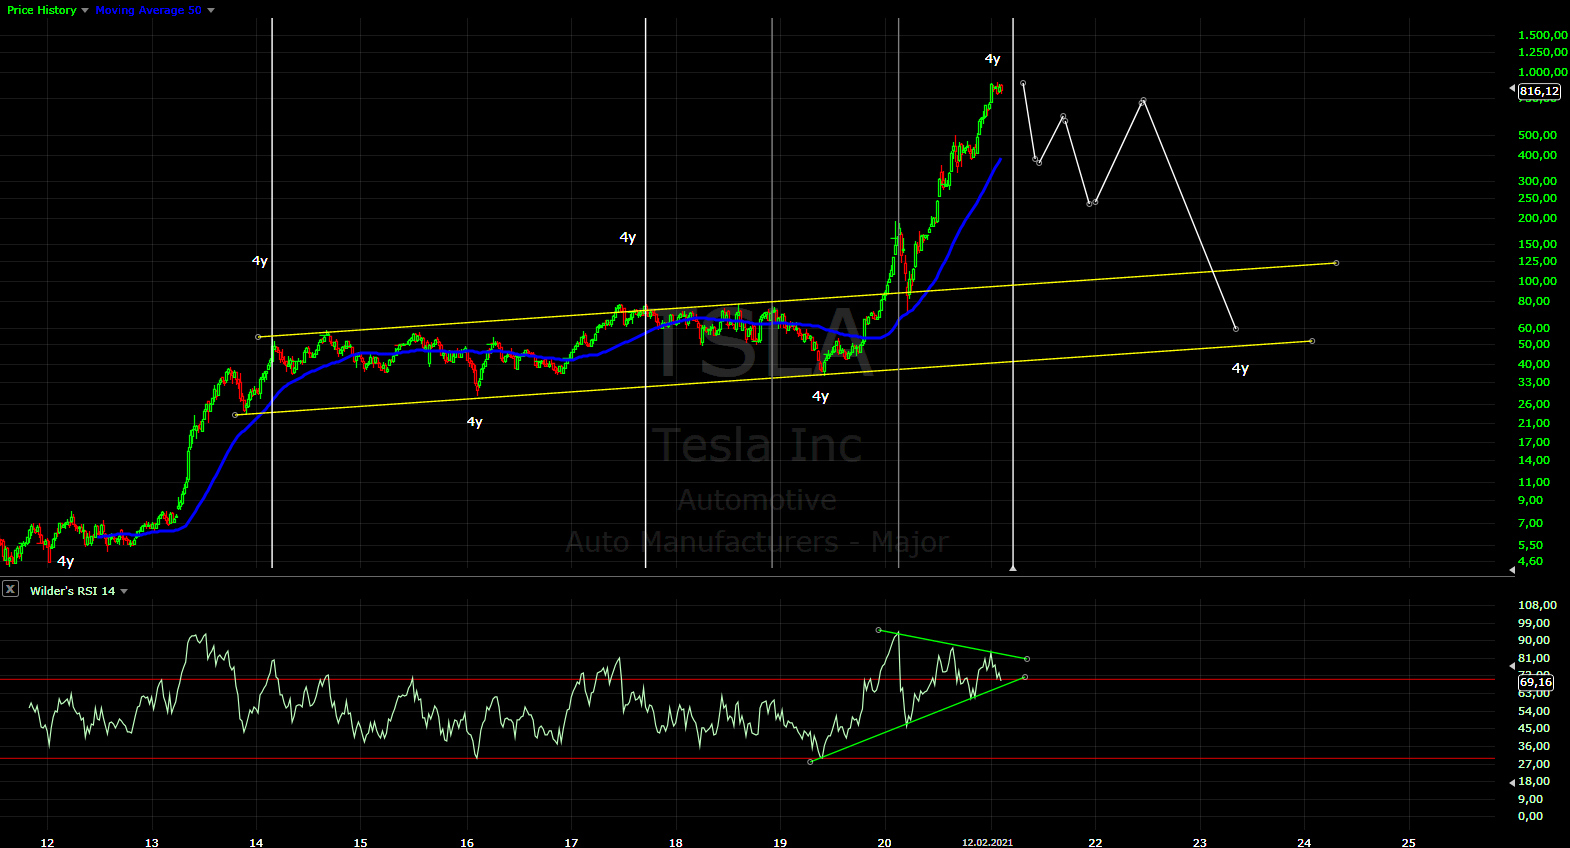
Again the highs - if we see two weeks up for 4x7weeks than time and final pattern for the second legs in 2019 and now will look the same:)