May 28, 2017

Weekly preview

Short term view - I expect pullback next week then we will see.
Intermediate term view - I do not believe in a strong rally, just waiting for the top and decline into the 18 month cycle bottom.

I was wrong this week... the signals were ok only short squeeze was missing on my watch list. I though the correction begun after a plunge with an impulse - obviously not. The expected "bounce" mutated in V-shape parabolic move with ever decreasing volume - this is the missing short squeeze.

The short term pattern has changed, but everything stays the same. For me this is still the top of iii of 3 or 3, the only question is how the pattern will look like. With so many up and down there is a lot of room for interpretation. Currently it looks like a diagonal to me, and I have added bearish/bullish option to watch. Intermediate term it is the same - week market breadth, divergences on the daily chart, next bigger move is lower into 18 month cycle low, TomDemark finished sequential on the weekly chart, Nasdaq with 5 waves from the March low and divergences.... difficult to spot something bullish.

VIX is again below 10. I think it moves similar to 1993/94 - below 10 -> short living pullback(the plunge)/VIX spike higher -> the indexes higher for a few weeks/VIX below 10 again -> bigger correction.


TECHNICAL PICTURE and ELLIOTT WAVES
Short term - with such moves in the last 3 months you can not be sure which count is right, EW has it's limitations. Currently it looks like diagonal to me.
- bullish option - starting from the April low we have 1-2(green) and now in wave 3. A pause 2-3 days and another vertical move should follow.... I do not see anything to support such price action. All my tools are saying the opposite.
- bearish option - the expanded flat is much bigger than expected, the plunge was b/B and this rally is finishing a-b-c for B(red). It is possible, but we need confirmation for a reversal.
On the chart is shown another option - diagonal. I do not think the price will reverse and plunge, I do not believe that the rally will continue, so I am just waiting for a setup with low risk.


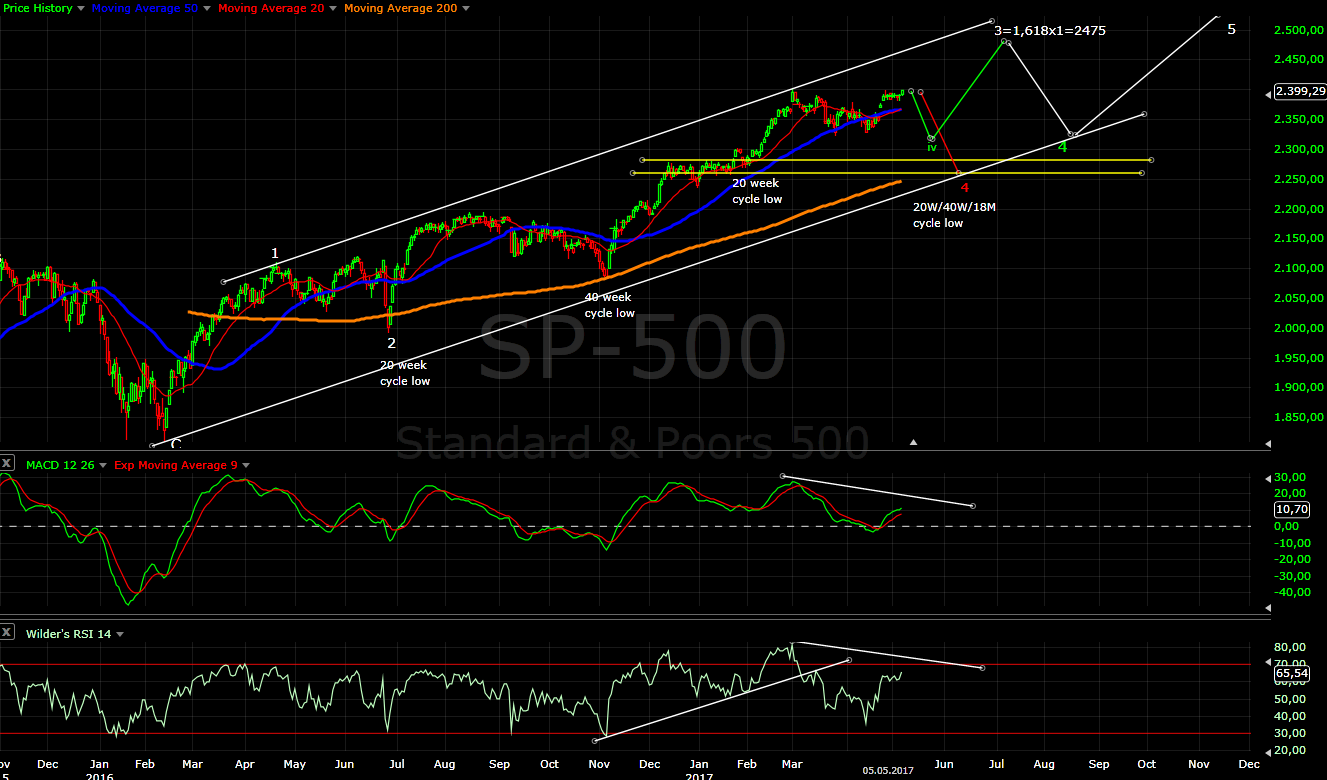
Intermediate term - for a bullish picture the price should continue vertically higher to erase the MACD/RSI divergences. I do not believe it. My preferred scenario is top of iii of 3(green).


Long term - if the move higher continue longer than expected and the RSI moves again in overbought territory, we will see divergences on the weekly charts, which means important top, which means this is wave 3 not iii of 3.


MARKET BREADTH INDICATORS
Market Breadth Indicators - if the market is so bullish and after such vertical move I would expect much more from market breadth. The indicators do not even think of moving into overbought territory... not even turning bullish.
McClellan Oscillator - barely above zero with long term divergence lower tops since late 2016.
McClellan Summation Index - buy signal, but with double divergence since March.
Weekly Stochastic of the Summation Index - sell signal.
Bullish Percentage - sell signal, below 70.
Percent of Stocks above MA50 - in the middle of the range.
Fear Indicator VIX - again below 10... not very bullish.
Advance-Decline Issues - in the middle of the range, strange it could not move to overbought territory since last year.


HURST CYCLES
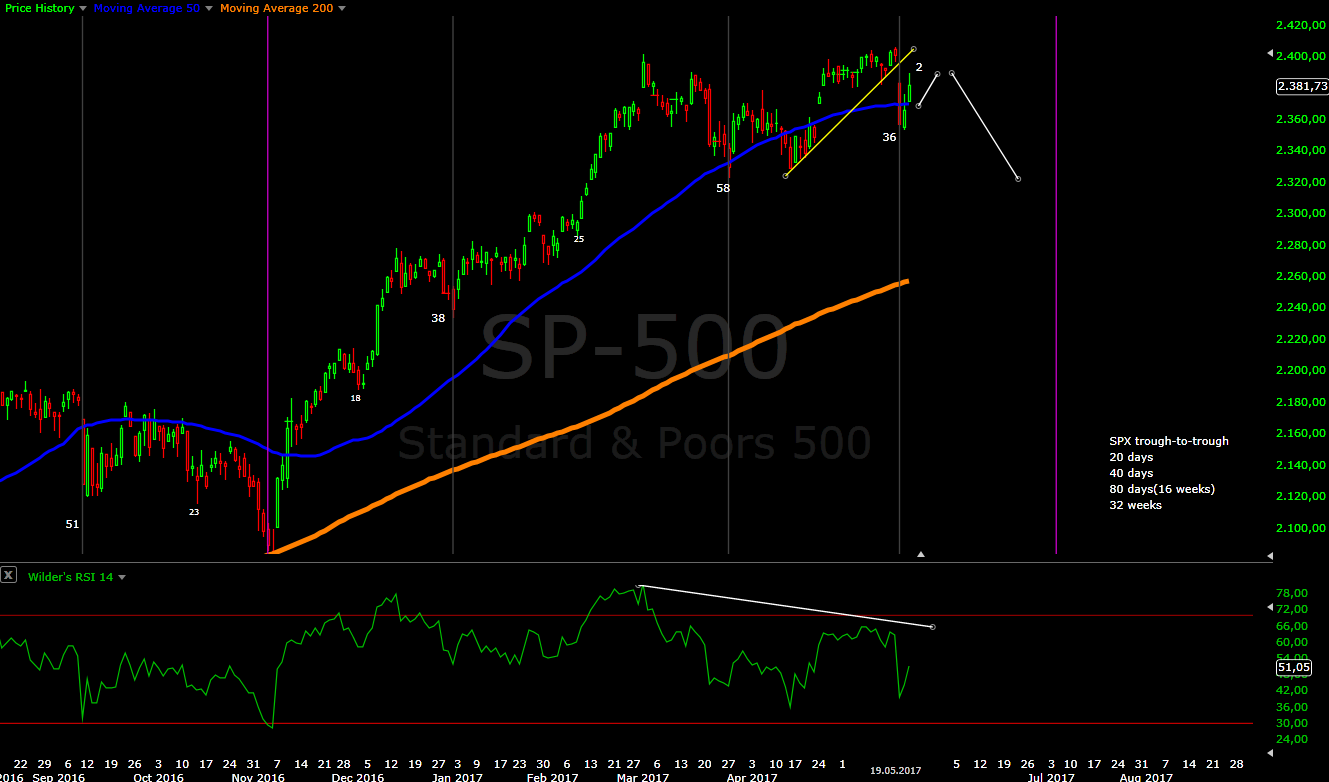
Day 7 of the 40 day cycle.


Week 8 of the last 20 week cycle, waiting for the top of the 18 month cycle.


Tom Demark SEQUENTIAL AND COUNTDOWN - this technique spots areas of exhaustion.
Bar 12 for combo/countdown without using minimum requirements(only higher high). Another higher high or higher close next week and we will have 13.

May 20, 2017

Weekly preview

Short term view - we should see another move lower.
Intermediate term view - the correction to continue for 2-4 weeks.

SP500 squeezed a few more points higher, but then turned lower as expected. The move lower looks like impulse to me, which means to expect more to the downside. Despite the strong retracement I think it is corrective and the direction is lower.

Wave C lower for expanded flat looks best to me at the moment, so the plan stays the same.
Alternate options if I am wrong - more bullish only one more leg lower for a-b-c - than it will look like wave C of a giant triangle for around 4 months since first of March until end of June/early July. Second option more bearish the correction is much bigger and this is just the begging of wave A lower. We will just watch how the price action develops.


TECHNICAL PICTURE and ELLIOTT WAVES
Short term - after an impulse another one in the same direction follows. If we saw wave 1 and 2 this week the Fibo measurement for an impulse point to a low around 2280 which is a support level(better visible on the daily chart).
The alternate options - with green triangle and red wave A of 4.


Intermediate term - MACD/RSI with divergence... expecting wave iv(green) to support, alternate it could be wave 4(red). Now waiting and watching how the move develops.


Long term - looking the oscillators(RSI,Stochastic with divergence) I think we should see a few weeks lower so that they can reset to at least the 50 level.


MARKET BREADTH INDICATORS
Market Breadth Indicators - are pointing lower and are not even close to oversold.... there is a lot of room to move lower.
McClellan Oscillator - below zero.
McClellan Summation Index - sell signal.
Weekly Stochastic of the Summation Index - sell signal.
Bullish Percentage - sell signal, now below 70.
Percent of Stocks above MA50 - in the middle of the range.
Fear Indicator VIX - spiked higher, curious to see if it will make a higher high.


HURST CYCLES
It is possible that we have one finished 40 day cycle. I have changed the weekly count and one shorter 40 day cycle plus one more to finish 20w/40w/18month cycle is expected.


Week 7 of the last 20 week cycle. I have changed the count, this move higher lasted too long and I think we have length 20 for the previous 20 week cycle and the current one caused the rally from April. It fits better with the price action, visually looks better... at the end it is only cosmetic change - instead of something like 11+20 we will have 20+11 for the 40 week cycle.


Tom Demark SEQUENTIAL AND COUNTDOWN - this technique spots areas of exhaustion.
This few points higher fit perfect - the minimum requirement for the last bars 11/12/13 is to make higher high. So if we take the minimum requirement we have finished countdown/combo on the weekly chart.

May 17, 2017

Update

The move lower counts perfect as an impulse, which means bounce higher and another leg lower should follow. This are preliminary measurements if we see perfect bounce to test the break lower MA200/MA50/resistance and perfect waves with text book Fibo size.
If it is only a-b-c(green I do not think this is the pattern) one more leg with the same size to around 2335. More likely an impulse lower for C of an expanded flat(red) to around 2290.... it should move at least below 2320.

May 13, 2017

Weekly preview

Short term view - no confirmation for a reversal, but I think next week should be lower.
Intermediate term view - not very clear, waiting to see next week.

SP500 squeezed 2 points above the March high and turned lower, but I do not see an impulse for confirmation. All indicators are pointing lower and I think next week should be lower.

The short term picture is messy. Since Brexit we have 4-5 weeks higher and 2-3 months sideway move, this is is repeating for the third time now. We have flat pattern for 11 weeks since 1-th of March. We have a few zig-zags and one impulse from the April low... accordingly many combinations - c of B for flat correction, final high for iii of 3 and iv just beginning, v of 3 running and this impulse is just the first wave higher, not forgetting and B of a triangle.

Intermediate term - I think we are in some kind of 4-th wave. I have changed 10 times my mind which is the most likely scenario and at the end I do not know exactly which pattern we have. This is typical with waves 4, more price action is necessary and we will know the pattern when it is mature.
Overall I do not think we saw the top of wave 3 and VIX historical behavior(see previous post) says this should be just iv of 3.


TECHNICAL PICTURE and ELLIOTT WAVES
Short term - this impulse can be counted different ways... interesting is all counts are pointing lower for the next week, indicators are pointing lower, the daily cycle is mature. I will be really surprised if we see a rally next week.
I am waiting to see the decline how deep it will be and if it is a impulse or corrective to negate some of the options.


Intermediate term - the histogram is pointing lower, RSI/MACD with lower high... so far the signs are for a move lower.
Preferred scenario is green wave iv of 3... just I do not know where to put it's low at the moment.


Long term - no change, waiting for the wave from Feb.2016 to be finished.


MARKET BREADTH INDICATORS
Market Breadth Indicators - are pointing lower.
McClellan Oscillator - below zero.
McClellan Summation Index - sell signal.
Weekly Stochastic of the Summation Index - sell signal.
Bullish Percentage - sell signal but still strong above 70.
Percent of Stocks above MA50 - turned lower, in the middle of the range.
Fear Indicator VIX - historical low values. I think it will rise and test the level one more time.
Advance-Decline Issues - turned lower, in the middle of the range.


HURST CYCLES
Day 33 of the 40 day cycle. It is mature and it is more likely to see a move lower.

Week 16 for the 20 week cycle. The picture is not 100% clear... if this is not wave C for iv of 3 the cycle count should be adjusted.


Tom Demark SEQUENTIAL AND COUNTDOWN - this technique spots areas of exhaustion.
If you follow the rules the count is still 11 for combo/countdown. For the last bars it is allowed to make only higher high to count them so this week could be 12 for combo/countdown. This tool allows "flexibility" too... like EW and cycles there is room for adjustment.

May 9, 2017

VIX record lows

According to the data on this page this is the 4-th lowest close. Interesting is what happens after that. As I wrote this weekend because of the very low VIX levels SP500 should be in wave iv of 3 since Feb.2016 and the bigger correction should come later... history seems to confirm this.

The same data from the page above by date:
Date --- Close
22 December 1993 --- 9.31
23 December 1993 --- 9.48
27 December 1993 --- 9.70
28 December 1993 --- 9.82
28 January 1994 --- 9.94
What happened after that -> small pullback -> 6% higher for 4 weeks -> 11% lower for 9 weeks

20 November 2006 --- 9.97
21 November 2006 --- 9.90
14 December 2006 --- 9.97
24 January 2007 --- 9.89
What happened after that -> small pullback(after every record low) -> 6% higher for 11 weeks(after the first record low) -> 7% lower for 4 weeks


What is common - after a record low small pullback follows, move higher roughly 6% and then bigger correction. The difference - in 1993 the move 6% higher was short 4 weeks and the correction long 11 weeks, in 2006 it was the opposite.

Now if we translate this in the current pattern:
- two options for the small drop - could be roughly 50 points (ii) of v of 3 to close the gap and test MA50(green pattern) or 80-90 points to 2310-2320 for expanded flat and finished iv of 3(red pattern).
- move higher for v of 3 - this is the 6% move higher... from 1320 to 1480(3=1,618x1) is again like in 1993/1994 and 2006/2007 roughly 6%:))))
- the bigger correction will be wave 4.

You know my preferred scenario - this is red. Cycles will fit like a glove - another 2-3 weeks lower for 17-18 weeks long 20 week cycle. Wave 4 for the 18 month cycle low it will stretch way too long and with a low behind us the 40 week cycle will be way too short. As I wrote weeks ago after long 40 week cycle(38 weeks) a shorter one follows according history since 2009 25-31 weeks long. With a low in 2-3 weeks we will have 28-29 weeks long 40 week cycle and 18 month cycle with average length as expected.


VIX 1993-1994. Short rally , the index with higher high VIX with higher low and divergence.


VIX 2006-2007. Slow rally crawling higher for almost three months and sharp decline.


VIX 2017 before a major top we will see a higher low and a break out from the wedge.

May 6, 2017

Weekly preview

Short term view - final move higher.
Intermediate term view - after it is over correction for a few weeks.

Boring week the pattern looks like bull flag and break out higher in the last hour... finally. In Europe the pattern looks mature I suspect euphoria(vertical move) before the french election creating expectations for a huge gap like two weeks ago... I think the news is already priced in and this is a bull trap.

Short term the pattern looks like expanded flat. So close to the previous top I am sure a lot of stops will be hit and then we will see a reversal.
Intermediate term VIX printed very low values again without divergence. This makes me think that we are watching iii and iv of 3. This is my primary scenario now and alternate that we have v of 3 and 4. I want to see a multiple divergences on VIX for a sentiment change. The sentiment will change gradually with several higher lows(VIX) before a major reversal. I read somewhere that this is the lowest value since Feb.2007,yes but after that we saw two more higher highs in 2007 before major top 8 months later.


TECHNICAL PICTURE and ELLIOTT WAVES
Short term - The move lower looks like a bull flag and break out. I think we are seeing v of c of B.
Alternate it could be impulse(green) from the March low. In this case this is 3 and we will see 4 and 5.


Intermediate term - Primary scenario is now iv of 3 and alternate wave 4. No need to make a decision now both scenaris are pointing lower for a few weeks. The market will show us what is going on. Wave 4(red) should last longer and move lower to at least MA200.
MACD/RSI ready for a divergence so any move higher should be short living and make an intermediate top.


Long term - no change, waiting for the wave from Feb.2016 to be finished.


MARKET BREADTH INDICATORS
The Market Breadth Indicators - not so bullish rather weak, some are turning lower, some with divergences...
McClellan Oscillator - at the zero line.
McClellan Summation Index - neutral... lower high so far.
Weekly Stochastic of the Summation Index - in overbought territory.
Bullish Percentage - technically sell signal with divergence, but it is still above 70.
Percent of Stocks above MA50 - in the middle of the range.
Fear Indicator VIX - spike higher and extreme complacency again... it will not last for long.


HURST CYCLES
Day 28 of the 40 day cycle... already mature and should turn lower soon.

Week 15 of the 20 week cycle and week 64 of the 18 month cycle. Both entered the time window for a low so I expect the indexes to turn lower soon for the 18 month cycle low.


Tom Demark SEQUENTIAL AND COUNTDOWN - this technique spots areas of exhaustion.
Most likely we will see week 12 from a countdown and combo next week, the question is if we will see 13 or not.

May 1, 2017

Update

We saw a move higher, bigger than expected, but I still think this is just B. The final wave higher could make higher high, but again this will be just B for expanded flat. FOMC on Wednesday perfect for a top.