
Nov 29, 2012
Short term update
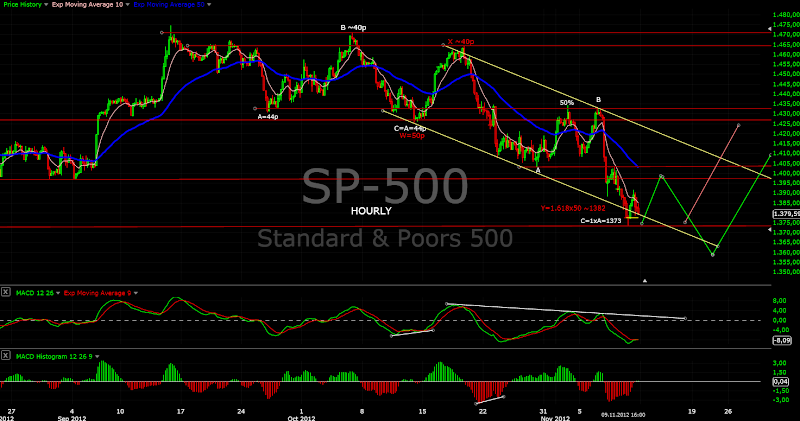
Current thoughts - I think the first wave up is done or almost done. Next week we should see more significant pullback not breaking bellow support around ~1375-1380 and the third wave up.
If I am wrong the wave X is finishing an the next move lower into 4-year low will begin soon. But that is the backup scenario:)

Nov 24, 2012
Weekly review
Short term view - 2-3 days weakness before moving higher.
Intermediate term view - I think we saw the intermediate term bottom which I was expecting.
Last week I wrote that I expect a bounce for 3-4 days (based on an extreme of the McClellan Oscillator) - there we have it. After such bounce usually follows a lower low but this move looks like a wave from a bigger degree so I think we will see a higher low and the move up which I was expecting for several weeks has already begun.
Next week I expect a retracement for 2-3 days and the move up should continue.
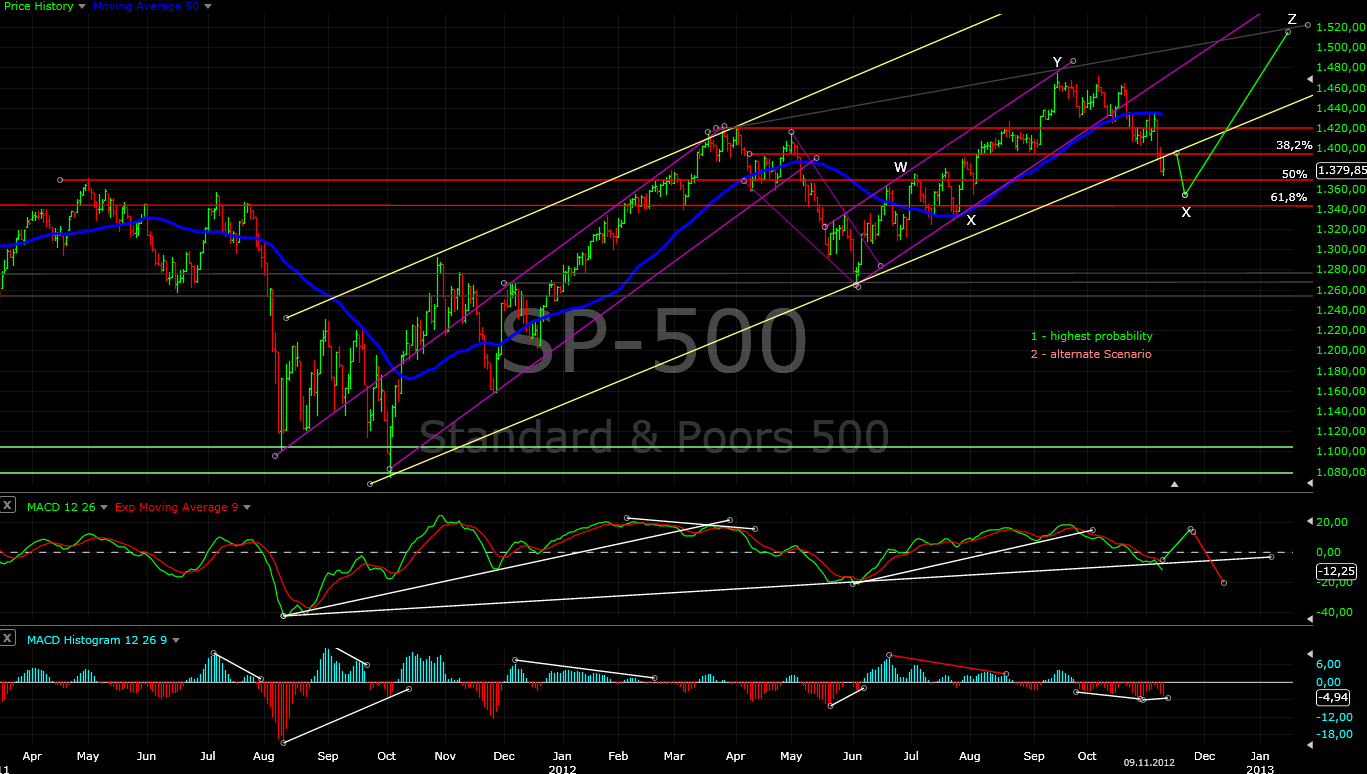
If I am right we have finished double zigzag W (from September to 16 November) and we should see now a rally for several weeks - X and final Low Y (the green scenario daily chart).
If I am wrong wave X of lower degree has finished and we will see final wave Z of a triple zigzag (the alternate scenario in red - see the hourly chart).
TECHNICAL PICTURE
Short term - the indexes are short term overbought, divergence on the histogram, testing the broken trend line (see daily chart) so I expect a pull back. There is support between 1380 and 1390.
If the move up is over the indexes should start dropping hard next week. But taking the seasonality in account that does not look very probable. Nevertheless we should be careful so we do not get surprised.
 Intermediate term - higher for several weeks into December.

MARKET BREADTH INDICATORS
The Market Breadth Indicators turned up confirming the move.
McClellan Oscillator - very strong move up which makes me think that this only the beginning of a bigger move.
McClellan Summation Index - turned up but still there is no buy signal. I think we will have one after a pullback next week.
Weekly Stochastic of the Summation Index - issued buy signal which again makes me think that this only the beginning of a bigger move.
Bullish Percentage - turned up but no buy signal for now...
Percent of Stocks above MA50 - in no mans land around 50... dipped bellow 25 and turned up that is bullish basically
Fear Indicator VXO - plunged lower as expected. The indicator has not reacted to the rally on Friday and moved outside the bollinger bands. That makes me think that we will see a pullback.
CYCLES (TD - trading days)
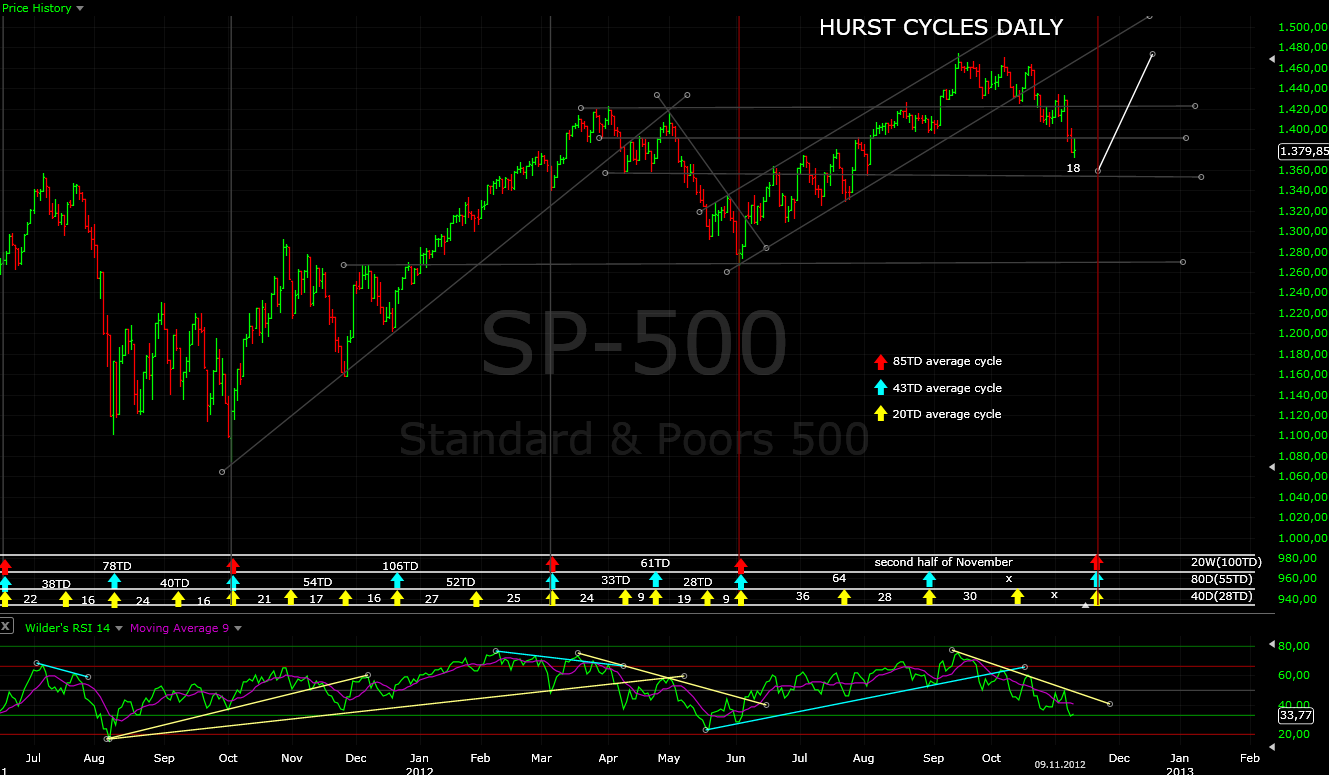
The cycle charts are not very clear too. We have two scenarios - the daily chart shows the first one that 20 week cycle has just begun and that means longer lasting rally and 4-year low early March. On the weekly chart the second one - nearing the end of the last 20 week cycle with 4-year low around the end of January.
We have finished 20 weekly cycle which was very stretched and lasted 24 weeks(average length is 18 weeks). The strength of this move suggests that the next cycle has begun.
 The alternate scenario is that we are in the middle of the last 20 week cycle before 18 month and 4 year cycle low.

Tom Demark SEQUENTIAL AND COUNTDOWN - this technique spots areas of exhaustion.
From last week - "I do not expect SP500 to close 25 points higher on Monday so we will see a setup completed on Monday"... well the market can make some one look like an idiot very easy:)
So the buy setup was invalidated but nevertheless we have our bottom:)
 We are at 7 of a setup of the weekly chart. I think we will have finished setup only if the alternate scenario plays out and the indexes start dropping hard next week.

Intermediate term view - I think we saw the intermediate term bottom which I was expecting.
Last week I wrote that I expect a bounce for 3-4 days (based on an extreme of the McClellan Oscillator) - there we have it. After such bounce usually follows a lower low but this move looks like a wave from a bigger degree so I think we will see a higher low and the move up which I was expecting for several weeks has already begun.
Next week I expect a retracement for 2-3 days and the move up should continue.
If I am right we have finished double zigzag W (from September to 16 November) and we should see now a rally for several weeks - X and final Low Y (the green scenario daily chart).
If I am wrong wave X of lower degree has finished and we will see final wave Z of a triple zigzag (the alternate scenario in red - see the hourly chart).
TECHNICAL PICTURE
Short term - the indexes are short term overbought, divergence on the histogram, testing the broken trend line (see daily chart) so I expect a pull back. There is support between 1380 and 1390.
If the move up is over the indexes should start dropping hard next week. But taking the seasonality in account that does not look very probable. Nevertheless we should be careful so we do not get surprised.


MARKET BREADTH INDICATORS
The Market Breadth Indicators turned up confirming the move.
McClellan Oscillator - very strong move up which makes me think that this only the beginning of a bigger move.
McClellan Summation Index - turned up but still there is no buy signal. I think we will have one after a pullback next week.
Weekly Stochastic of the Summation Index - issued buy signal which again makes me think that this only the beginning of a bigger move.
Bullish Percentage - turned up but no buy signal for now...
Percent of Stocks above MA50 - in no mans land around 50... dipped bellow 25 and turned up that is bullish basically
Fear Indicator VXO - plunged lower as expected. The indicator has not reacted to the rally on Friday and moved outside the bollinger bands. That makes me think that we will see a pullback.
CYCLES (TD - trading days)
The cycle charts are not very clear too. We have two scenarios - the daily chart shows the first one that 20 week cycle has just begun and that means longer lasting rally and 4-year low early March. On the weekly chart the second one - nearing the end of the last 20 week cycle with 4-year low around the end of January.
We have finished 20 weekly cycle which was very stretched and lasted 24 weeks(average length is 18 weeks). The strength of this move suggests that the next cycle has begun.


Tom Demark SEQUENTIAL AND COUNTDOWN - this technique spots areas of exhaustion.
From last week - "I do not expect SP500 to close 25 points higher on Monday so we will see a setup completed on Monday"... well the market can make some one look like an idiot very easy:)
So the buy setup was invalidated but nevertheless we have our bottom:)


Nov 17, 2012
Weekly review
Short term view - bounce for 3-4 days from oversold levels and another sell off.
Intermediate term view - waiting for the final sell off after a bounce.
So I was expecting some bounce to 1395-1400 and move lower as the next support level is 61,8% Fibo around 1345.... well SP500 made it only to 1390 and plunge to the support level - no surprise.
This whole correction lasts too long and is too deep so I think it is a part of a bigger move as we should see soon the end of the first wave down. I think we saw a four year peak in September and now we are moving towards 18 month and a four year low around the end of January (see cycles chart).
So what I expect - bottom in the next week or two, a rally in December 3-4 weeks and THE low for the correction around the end of January.
TECHNICAL PICTURE
Short term - bounce to relief the oversold conditions. Targets are 1370 and 1380.
 Intermediate term - a lot of technical damages, broken trend lines etc. But the correction is running for 9 weeks already. The move is too stretched to the downside, look at where the MA50 is. So I think after some work on bottom we will see a snap back rally to MA50 and to test the broken trend line.
New high(red lines/count) is still on the radar but it does not look very promising....

MARKET BREADTH INDICATORS
The Market Breadth Indicators are negative no doubt but at levels at which we can see a bottom soon. Of course they can get more negative and oversold:) What I mean is if we see something like a bottom it will be credible.
McClellan Oscillator - hit extremes at 92. Usually when we see such levels a bounce follows - exactly that happened on Friday. I looked back the charts and after such extreme there is a bounce for 4-6 days and that is not the low. There is a lower low with divergence and that is THE low.
McClellan Summation Index - still on sell, that is to expect when the oscillator is bellow the zero line.
Weekly Stochastic of the Summation Index - reached oversold levels, now waiting for a bottoming signal. It can stay oversold for a few weeks.
Bullish Percentage - has fallen to 58. As i have said the pullback morphed to a correction and the indicator is confirming this. Pullbacks stay around the 65-70 levels and correction around 45-50.
Percent of Stocks above MA50 - has fallen bellow 25. At this levels correction usually find a bottom.
Fear Indicator VXO - touched 20 again and reversed. The chart is looking bearish which is in line with my expectation for a move higher in the next days.
Put to Call Ratio - nearing to zone for a bottom.
CYCLES (TD - trading days)
As I have said above the correction lasts too long and is too deep so I think we saw a four year peak in September and now we are moving towards 18 month and a four year low around the end of January. I have changed my cycle count because this one fits much better.
In August the Indexes were moving sideways for 3-4 weeks and that was probably the low of a 20 week cycle which was short and lasted only 13 weeks. now we are in the middle of the next one - week 11.

Tom Demark SEQUENTIAL AND COUNTDOWN - this technique spots areas of exhaustion.
At last something interesting after all this noise:)
I do not expect SP500 to close 25 points higher on Monday so we will see a setup completed on Monday that fits perfect with short term bottom and a bounce.
 On the weekly chart we have 6 of a setup. I will not be surprised to see a buy setup finished as the indexes need some time to work on a bottom before a snap back rally in December.

Intermediate term view - waiting for the final sell off after a bounce.
So I was expecting some bounce to 1395-1400 and move lower as the next support level is 61,8% Fibo around 1345.... well SP500 made it only to 1390 and plunge to the support level - no surprise.
This whole correction lasts too long and is too deep so I think it is a part of a bigger move as we should see soon the end of the first wave down. I think we saw a four year peak in September and now we are moving towards 18 month and a four year low around the end of January (see cycles chart).
So what I expect - bottom in the next week or two, a rally in December 3-4 weeks and THE low for the correction around the end of January.
TECHNICAL PICTURE
Short term - bounce to relief the oversold conditions. Targets are 1370 and 1380.

New high(red lines/count) is still on the radar but it does not look very promising....

MARKET BREADTH INDICATORS
The Market Breadth Indicators are negative no doubt but at levels at which we can see a bottom soon. Of course they can get more negative and oversold:) What I mean is if we see something like a bottom it will be credible.
McClellan Oscillator - hit extremes at 92. Usually when we see such levels a bounce follows - exactly that happened on Friday. I looked back the charts and after such extreme there is a bounce for 4-6 days and that is not the low. There is a lower low with divergence and that is THE low.
McClellan Summation Index - still on sell, that is to expect when the oscillator is bellow the zero line.
Weekly Stochastic of the Summation Index - reached oversold levels, now waiting for a bottoming signal. It can stay oversold for a few weeks.
Bullish Percentage - has fallen to 58. As i have said the pullback morphed to a correction and the indicator is confirming this. Pullbacks stay around the 65-70 levels and correction around 45-50.
Percent of Stocks above MA50 - has fallen bellow 25. At this levels correction usually find a bottom.
Fear Indicator VXO - touched 20 again and reversed. The chart is looking bearish which is in line with my expectation for a move higher in the next days.
Put to Call Ratio - nearing to zone for a bottom.
CYCLES (TD - trading days)
As I have said above the correction lasts too long and is too deep so I think we saw a four year peak in September and now we are moving towards 18 month and a four year low around the end of January. I have changed my cycle count because this one fits much better.
In August the Indexes were moving sideways for 3-4 weeks and that was probably the low of a 20 week cycle which was short and lasted only 13 weeks. now we are in the middle of the next one - week 11.

Tom Demark SEQUENTIAL AND COUNTDOWN - this technique spots areas of exhaustion.
At last something interesting after all this noise:)
I do not expect SP500 to close 25 points higher on Monday so we will see a setup completed on Monday that fits perfect with short term bottom and a bounce.


Nov 10, 2012
Weekly review
Short term view - corrective bounce and final low.
Intermediate term view - expecting intermediate term bottom in the next week or two.
I was right for the direction that there is more to the downside and the herd must be scared before any move higher. I was wrong for the level, I thought the 38,2% Fibo around 1395 will hold... this week SP500 touched the 50% Fibo at 1370. I mentioned it last week that we can be surprised with a move to 1370-1375 where C=A but I thought it has low probability... well I was wrong. The more important is that I was not caught on the wrong side.
I know it looks ugly, divergences on the weekly charts, the expected pullback 3%-5% is now a correction with 7% drop lasting two months already...
Nevertheless I still think there is one more move up:
- on the weekly chart we have divergences but on the other side we have a cluster of support levels.(see the long term chart)
- Looking the European indexes the DAX for an example has a bull flag and does not look scary.
-major tops develop for months and not just start dropping. There is no divergences on the VIX, Bullish percentage or any other Market Breadth Indicator...
- and the most important the EUR looks like there will be a strong move on the upside(see the cycle charts of the EUR bellow). That means "risk on" trades and the commodities confirming this... the stocks should follow.
TECHNICAL PICTURE
Short term - I expect some kind of a bounce which will be corrective and another sell off. Resistance is around 1400.
 Intermediate term - no signs of a bottom probably we will see a lower low. Next support level and 61,8% Fibo is ~1345
 Long term - weekly chart which I have shown many times. Soon we will know if I am right. At this levels we have support, EMA50 and the trend line - pretty strong cluster of support. If not a new high at least a bounce should be in the cards.

MARKET BREADTH INDICATORS
The Market Breadth Indicators are confirming the move. There is no any signs of a bottom or divergence. They are saying there is more on the downside.
McClellan Oscillator - made lower low, the correction is not finished.
McClellan Summation Index - still in sell mode.
Weekly Stochastic of the Summation Index - reached oversold levels, now waiting for a bottoming signal. It can stay oversold for a few weeks.
Bullish Percentage - reached 65 which was my bottom level for this correction. Probably will move lower, still at elevated levels for a correction.
Percent of Stocks above MA50 - in my target zone 25-35 at 31. Lower low expected so 25 here we come:)
Fear Indicator VXO - touched my target of 20. Not finished on the upside. I expect to see another move to 20-22 before the end of the correction.
CYCLES (TD - trading days)
The current 20 week cycle is very stretched already - 23 weeks. This is the daily chart, I have changed the small cycles to reflect the stretched bigger cycle.

We had very strong rally of the 18 month cycle bottom and in the next weeks we should see the bottom of the first 20 week cycle and the beginning of the next one. The EUR is making a bull flag testing the broken trend line from the outside and when the next rally starts we should see at least 1,35. I think we have "risk on" game, the commodities are confirming it... and the stocks should follow.

The weekly chart of the EUR says that 18 month cycle has begun and there is plenty of room on the upside and time until the EUR start moving lower.

Tom Demark SEQUENTIAL AND COUNTDOWN - this technique spots areas of exhaustion.
The daily chart is a mess nothing interesting, the weekly shows 5 of a buy setup. Lets see what will happen in the next weeks.

Intermediate term view - expecting intermediate term bottom in the next week or two.
I was right for the direction that there is more to the downside and the herd must be scared before any move higher. I was wrong for the level, I thought the 38,2% Fibo around 1395 will hold... this week SP500 touched the 50% Fibo at 1370. I mentioned it last week that we can be surprised with a move to 1370-1375 where C=A but I thought it has low probability... well I was wrong. The more important is that I was not caught on the wrong side.
I know it looks ugly, divergences on the weekly charts, the expected pullback 3%-5% is now a correction with 7% drop lasting two months already...
Nevertheless I still think there is one more move up:
- on the weekly chart we have divergences but on the other side we have a cluster of support levels.(see the long term chart)
- Looking the European indexes the DAX for an example has a bull flag and does not look scary.
-major tops develop for months and not just start dropping. There is no divergences on the VIX, Bullish percentage or any other Market Breadth Indicator...
- and the most important the EUR looks like there will be a strong move on the upside(see the cycle charts of the EUR bellow). That means "risk on" trades and the commodities confirming this... the stocks should follow.
TECHNICAL PICTURE
Short term - I expect some kind of a bounce which will be corrective and another sell off. Resistance is around 1400.


MARKET BREADTH INDICATORS
The Market Breadth Indicators are confirming the move. There is no any signs of a bottom or divergence. They are saying there is more on the downside.
McClellan Oscillator - made lower low, the correction is not finished.
McClellan Summation Index - still in sell mode.
Weekly Stochastic of the Summation Index - reached oversold levels, now waiting for a bottoming signal. It can stay oversold for a few weeks.
Bullish Percentage - reached 65 which was my bottom level for this correction. Probably will move lower, still at elevated levels for a correction.
Percent of Stocks above MA50 - in my target zone 25-35 at 31. Lower low expected so 25 here we come:)
Fear Indicator VXO - touched my target of 20. Not finished on the upside. I expect to see another move to 20-22 before the end of the correction.
CYCLES (TD - trading days)
The current 20 week cycle is very stretched already - 23 weeks. This is the daily chart, I have changed the small cycles to reflect the stretched bigger cycle.
We had very strong rally of the 18 month cycle bottom and in the next weeks we should see the bottom of the first 20 week cycle and the beginning of the next one. The EUR is making a bull flag testing the broken trend line from the outside and when the next rally starts we should see at least 1,35. I think we have "risk on" game, the commodities are confirming it... and the stocks should follow.

The weekly chart of the EUR says that 18 month cycle has begun and there is plenty of room on the upside and time until the EUR start moving lower.

Tom Demark SEQUENTIAL AND COUNTDOWN - this technique spots areas of exhaustion.
The daily chart is a mess nothing interesting, the weekly shows 5 of a buy setup. Lets see what will happen in the next weeks.

Nov 6, 2012
Short term update
Update 08.11 - the trend line and support level broken. So the correction will last longer as I thought and SP500 will touch at least the 50% retracement 1370-1375.
 Wow its developing so fast if you blink you will miss the action:))
Huge candles mark the beginning or the end of a move... after 7 weeks correction the logical conclusion is that todays huge bar should mark the end of the correction. I expect bottoming in the next day or two.
Wow its developing so fast if you blink you will miss the action:))
Huge candles mark the beginning or the end of a move... after 7 weeks correction the logical conclusion is that todays huge bar should mark the end of the correction. I expect bottoming in the next day or two.
 Current thoughts....


Nov 3, 2012
Weekly review
Short term view - the beginning of the week should be negative but after that I expect reversal.
Intermediate term view - final move lower has begun. I expect to see an intermediate term bottom next week.
Last week I wrote - "Target is the zone between 38,2% and 50% Fibo retrace 1428-1433 (MA50 on the daily chart is at 1434 so it looks like a logical target)". That is what happened this week - Thursday move up to 1428 and on Friday spike to MA50 on the daily chart 1434 followed by a reversal.
We are near to an intermediate term bottom. I think that next week the correction will finish and the next move up will start. The only question is from which level - something like double bottom around 1405 or SP500 will reach its target around 1395 which I am showing since the beginning of this correction
TECHNICAL PICTURE
Short term - I am expecting SP500 to move lower to the 1398-1392 area. Its my preferred target since the beginning of this correction - 38,2% Fibo retracement of the June-September rally(see the daily chart), support zone, the trend line connecting the October 2011 and the June 2012 lows and if you measure the waves it looks perfect C=0,618xA/Z=1,618xW(Y).
The alternative is something like a double bottom around 1405.
 Intermediate term - nothing has really changed since last week... just up-to-date chart. MACD is turning up at its trend line as expected and the price is near to the support line and the trend line(DJ touched them already).
A surprise move could be the break of the trend line in that case next stop is the 50% Fibo retracement and the support zone 1370-1375 at this levels we have C=A too.

MARKET BREADTH INDICATORS
The Market Breadth Indicators are confirming that the direction is still down but this move is mature.
McClellan Oscillator - I expect to see a divergence after the move lower is finished.
McClellan Summation Index - still in sell mode.
Weekly Stochastic of the Summation Index - reached oversold levels, now waiting for a bottoming signal.
Bullish Percentage - not impressed at all - stays at the 70 level. I do not expect to see it bellow 65 which confirms that this is just a pullback.
Percent of Stocks above MA50 - shallow sell off and divergence or panic for a day or two and levels between 25 and 35 will mark the bottom.
Fear Indicator VXO - reached 19 my target for the correction is 20... its not too late:)
Put to Call Ratio - moving towards a bottom.
CYCLES (TD - trading days)
This cycle is already very late in the timing band so waiting for a bottom any moment...

Tom Demark SEQUENTIAL AND COUNTDOWN - this technique spots areas of exhaustion.
Nothing interesting to show... as expected the buy setup was invalidated.
Intermediate term view - final move lower has begun. I expect to see an intermediate term bottom next week.
Last week I wrote - "Target is the zone between 38,2% and 50% Fibo retrace 1428-1433 (MA50 on the daily chart is at 1434 so it looks like a logical target)". That is what happened this week - Thursday move up to 1428 and on Friday spike to MA50 on the daily chart 1434 followed by a reversal.
We are near to an intermediate term bottom. I think that next week the correction will finish and the next move up will start. The only question is from which level - something like double bottom around 1405 or SP500 will reach its target around 1395 which I am showing since the beginning of this correction
TECHNICAL PICTURE
Short term - I am expecting SP500 to move lower to the 1398-1392 area. Its my preferred target since the beginning of this correction - 38,2% Fibo retracement of the June-September rally(see the daily chart), support zone, the trend line connecting the October 2011 and the June 2012 lows and if you measure the waves it looks perfect C=0,618xA/Z=1,618xW(Y).
The alternative is something like a double bottom around 1405.

A surprise move could be the break of the trend line in that case next stop is the 50% Fibo retracement and the support zone 1370-1375 at this levels we have C=A too.

MARKET BREADTH INDICATORS
The Market Breadth Indicators are confirming that the direction is still down but this move is mature.
McClellan Oscillator - I expect to see a divergence after the move lower is finished.
McClellan Summation Index - still in sell mode.
Weekly Stochastic of the Summation Index - reached oversold levels, now waiting for a bottoming signal.
Bullish Percentage - not impressed at all - stays at the 70 level. I do not expect to see it bellow 65 which confirms that this is just a pullback.
Percent of Stocks above MA50 - shallow sell off and divergence or panic for a day or two and levels between 25 and 35 will mark the bottom.
Fear Indicator VXO - reached 19 my target for the correction is 20... its not too late:)
Put to Call Ratio - moving towards a bottom.
CYCLES (TD - trading days)
This cycle is already very late in the timing band so waiting for a bottom any moment...

Tom Demark SEQUENTIAL AND COUNTDOWN - this technique spots areas of exhaustion.
Nothing interesting to show... as expected the buy setup was invalidated.
Subscribe to:
Posts (Atom)