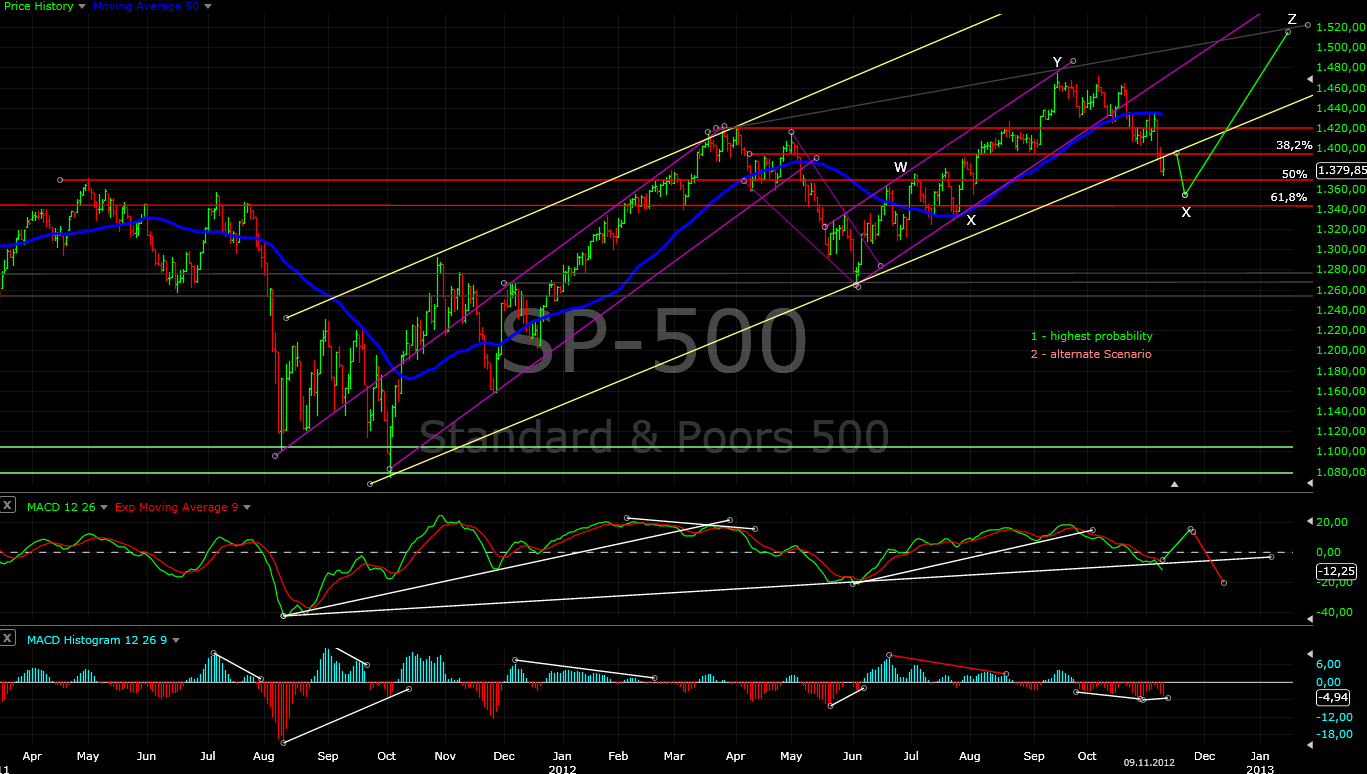
Intermediate term view - expecting intermediate term bottom in the next week or two.
I was right for the direction that there is more to the downside and the herd must be scared before any move higher. I was wrong for the level, I thought the 38,2% Fibo around 1395 will hold... this week SP500 touched the 50% Fibo at 1370. I mentioned it last week that we can be surprised with a move to 1370-1375 where C=A but I thought it has low probability... well I was wrong. The more important is that I was not caught on the wrong side.
I know it looks ugly, divergences on the weekly charts, the expected pullback 3%-5% is now a correction with 7% drop lasting two months already...
Nevertheless I still think there is one more move up:
- on the weekly chart we have divergences but on the other side we have a cluster of support levels.(see the long term chart)
- Looking the European indexes the DAX for an example has a bull flag and does not look scary.
-major tops develop for months and not just start dropping. There is no divergences on the VIX, Bullish percentage or any other Market Breadth Indicator...
- and the most important the EUR looks like there will be a strong move on the upside(see the cycle charts of the EUR bellow). That means "risk on" trades and the commodities confirming this... the stocks should follow.
TECHNICAL PICTURE
Short term - I expect some kind of a bounce which will be corrective and another sell off. Resistance is around 1400.


MARKET BREADTH INDICATORS
The Market Breadth Indicators are confirming the move. There is no any signs of a bottom or divergence. They are saying there is more on the downside.
McClellan Oscillator - made lower low, the correction is not finished.
McClellan Summation Index - still in sell mode.
Weekly Stochastic of the Summation Index - reached oversold levels, now waiting for a bottoming signal. It can stay oversold for a few weeks.
Bullish Percentage - reached 65 which was my bottom level for this correction. Probably will move lower, still at elevated levels for a correction.
Percent of Stocks above MA50 - in my target zone 25-35 at 31. Lower low expected so 25 here we come:)
Fear Indicator VXO - touched my target of 20. Not finished on the upside. I expect to see another move to 20-22 before the end of the correction.
CYCLES (TD - trading days)
The current 20 week cycle is very stretched already - 23 weeks. This is the daily chart, I have changed the small cycles to reflect the stretched bigger cycle.
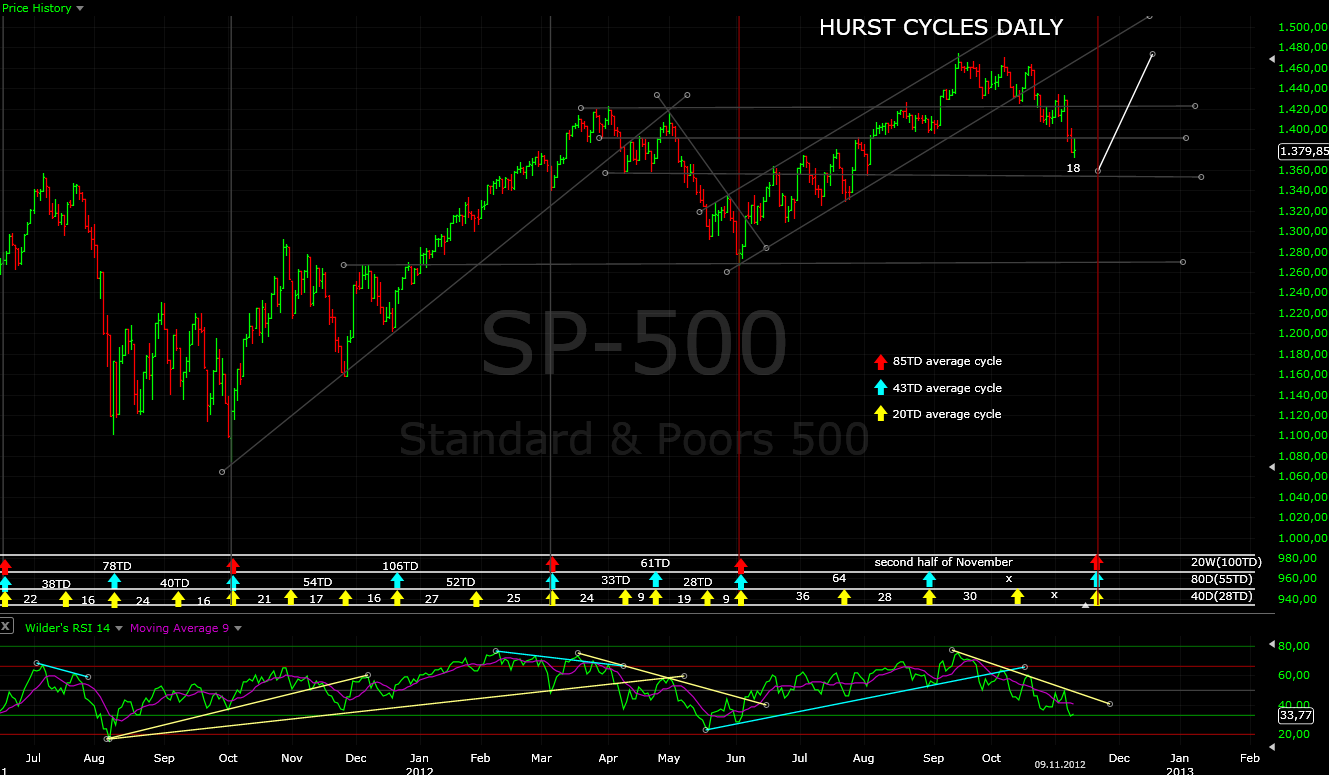
We had very strong rally of the 18 month cycle bottom and in the next weeks we should see the bottom of the first 20 week cycle and the beginning of the next one. The EUR is making a bull flag testing the broken trend line from the outside and when the next rally starts we should see at least 1,35. I think we have "risk on" game, the commodities are confirming it... and the stocks should follow.

The weekly chart of the EUR says that 18 month cycle has begun and there is plenty of room on the upside and time until the EUR start moving lower.

Tom Demark SEQUENTIAL AND COUNTDOWN - this technique spots areas of exhaustion.
The daily chart is a mess nothing interesting, the weekly shows 5 of a buy setup. Lets see what will happen in the next weeks.

No comments:
Post a Comment