Mar 23, 2014

Short Update

I am very busy and I have no time and energy to write something. That is why there were no update last week, this week and probably I will skip the next one too.... not sure for now.
That is why only a short update, nothing dramatically is happening anyway:))) I do not think that we will see an important reversal as often happens in March.

As I wrote two weeks ago I see a correction and nothing more. What happened - we saw one week choppy move lower and one week 3 waves corrective move higher. I think now it is time for the next wave lower from the correction and the reversal from Friday confirms it. Potential targets 1830-1835 and the 1800-1810 area.
Here is how the big picture looks like.... below 1800 it will start looking ugly until than we are watching the red scenario.

Mar 9, 2014

Weekly review

Short term view - pullback maybe....
Intermediate term view - I do not see signs for something more than a pullback...

Nothing has changed - choppy move but with upward slope. The price moved briefly bellow the last minor low 1840 that was all to the downside for the week.

The divergences does not look any better the histogram daily/McClellan Oscillator, but I do not see signs from the other indicators for now that this will be something more than a pullback.
The minor low for the last three days after the huge bar is 1870 and move below it will mean a pullback. The next support level is 1850 the top from January. As long the price stays above 1835 (MA50 is around there too) the intermediate term trend stays up.
SP500 looks strong, but what I do not like is the DAX - it looks bad. It looks like it made the right shoulder of a H&S. It is not common to diverge with the American indexes and this could be a warning that this is an intermediate term top for SP500....
My advice take some profits if it moves bellow 1850 and take all profits if it moves bellow 1835. In the mean time we will watch how it moves lower to decide if this is a pullback or something more.

TECHNICAL PICTURE
Short term - If the price moves bellow last minor low 1870 I think we will see move to the lower end of this megaphone and to support around 1850.
- Triple cross(EMA10 and EMA20 crossing EMA50) - short term trend is still up

Intermediate term - MACD moved above the down sloping trend line, but we have histogram divergence, so my conclusion is we stick further to the red scenario.
- Trend direction EMA50/MACD - intermediate term trend points up.
- Momentum Histogram/RSI - momentum points lower with divergence - pullback at last?

Long term - I do not think that this move will clear the MACD divergence and the move will fail to start another long lasting rally.
- Trend direction EMA50/MACD - the long term trend is up - the price above MA50 and MACD above zero. The MACD divergence should make you worry, that the long term trend can reverse soon.
- Momentum Histogram/RSI - momentum turned up, the intermediate term trend is up.


MARKET BREADTH INDICATORS
The Market Breadth Indicators - the oscillators show divergences and look even worse, the trend following indicators look ok and are improving. So the conclusion is the same pullback and another move higher before reversal.
McClellan Oscillator - continue dropping and the divergence is getting bigger.
McClellan Summation Index - buy signal, and near the highs from 2013.
Weekly Stochastic of the Summation Index - buy signal, it reached the overbought level.
Bullish Percentage - buy signal, but still below the previous highs.
Percent of Stocks above MA50 - looks ok for now.
Fear Indicator VIX - the next higher low... this is a big red flag.
Advance-Decline Issues - divergence, we should see a pullback.
Put/Call ratio - historic low levels again... mania again
Percent of Stocks above MA200 - are improving.


HURST CYCLES
We nearing the time frame where we usually see 40 day cycle top.
Another green and confirmation that this should be the next 20 week cycle....


Tom Demark SEQUENTIAL AND COUNTDOWN - this technique spots areas of exhaustion.
I think the countdown will be finished before any meaningful move lower.
As I wrote I do not think that the move up is over and with restrictive rules we have combo and countdown currently at 12.

Mar 6, 2014

Update

The impulse looks now finished... on the DJ it looks even better. Histogram divergences on the hourly and daily chart. If you are a short term trader it is not a bad idea to take profits.

Mar 4, 2014

Update

Only short living intraday break bellow 1840... the line in the sand moved at 1835. The move yesterday was three waves(corrective) and today it looks impulsive currently in wave 3 with wave 4 and 5 to follow. This means the ball is still in the bulls. The move since 19.02 is very ugly and choppy, but as long as we see 3 waves lower ant 5 waves higher the trend is up.
Cycles - this should be the beginning of the next 20 day cycle, but the bulls should show more strength and clear the MACD divergence to prove it.

Mar 2, 2014

Weekly review

Short term view - very careful we can see a pullback if price breaks bellow 1840.
Intermediate term view - my feeling tells me, the move to the upside is not finished.

Green week as expected. Short term we did not see a pullback, but 1835 has not been broken and the signal was not activated. Now the level is at 1840.

Short term - exactly the same story as last week. I can just copy/paste - toping tails, oscillators with divergences etc. The difference is this time I think we will see a pullback.
Intermediate term - I think that we have confirmation that the next 20 week cycle is running(4 weeks already to the upside), the indicators look to me like anything to the downside will be just a pullback(as long as the price stays above 1810).

Very often in March occur important reversals tops/bottoms, the whole move since 2012 is very stretched as time/price/sentiment, the current rally is not really healthy and convincing, I will not be surprised if we see a sharp reversal. It could be now it could be in 2-3 weeks. The strategy to follow the price higher for the last several weeks was right and my feeling tells me we are not finished to the upside but it is time to be cautious. This week we have another signal to the mix - see Demark bellow I think it is important.
Trading advice - if you see a move bellow 1840 for active traders you can short it... if you have longer term view and you think that there is more upside nevertheless be prudent and take some profits, later you can add to the position if the price start moving higher again.

TECHNICAL PICTURE
Short term - If the price breaks bellow 1840 the next target is 1810-1815. Than we will see what happens...
- Triple cross(EMA10 and EMA20 crossing EMA50) - short term trend is still up, but with double MACD divergence I think we will see a pullback.

Intermediate term - the both scenarios. As long MA50 and 1810 support hold the red one is the preferred.
- Trend direction EMA50/MACD - intermediate term trend turned up.
- Momentum Histogram/RSI - momentum still points lower - pullback at last?

Long term - I do not think that this move will clear the MACD divergence and the move will fail to start another long lasting rally.
- Trend direction EMA50/MACD - the long term trend is up - the price above MA50 and MACD above zero. The MACD divergence should make you worry, that the long term trend can reverse soon.
- Momentum Histogram/RSI - momentum turned up, the intermediate term trend is up.


MARKET BREADTH INDICATORS
The Market Breadth Indicators - the oscillators show divergences, the trend following indicators look ok for now and do not show signs for a pending trouble.
McClellan Oscillator - divergence.
McClellan Summation Index - buy signal, looks ok for now, made higher high.
Weekly Stochastic of the Summation Index - buy signal, next week it will reach the overbought level.
Bullish Percentage - managed to move above 70, but still below the previous highs.
Percent of Stocks above MA50 - almost reached 75, but still below the previous highs.
Fear Indicator VIX - the next higher low... draw a line between the lows since 2013 and you will see that they are trending higher... this does not look bullish.
Advance-Decline Issues - I expect to see a divergence after the next move higher.
Put/Call ratio - still at elevated levels and with divergence.
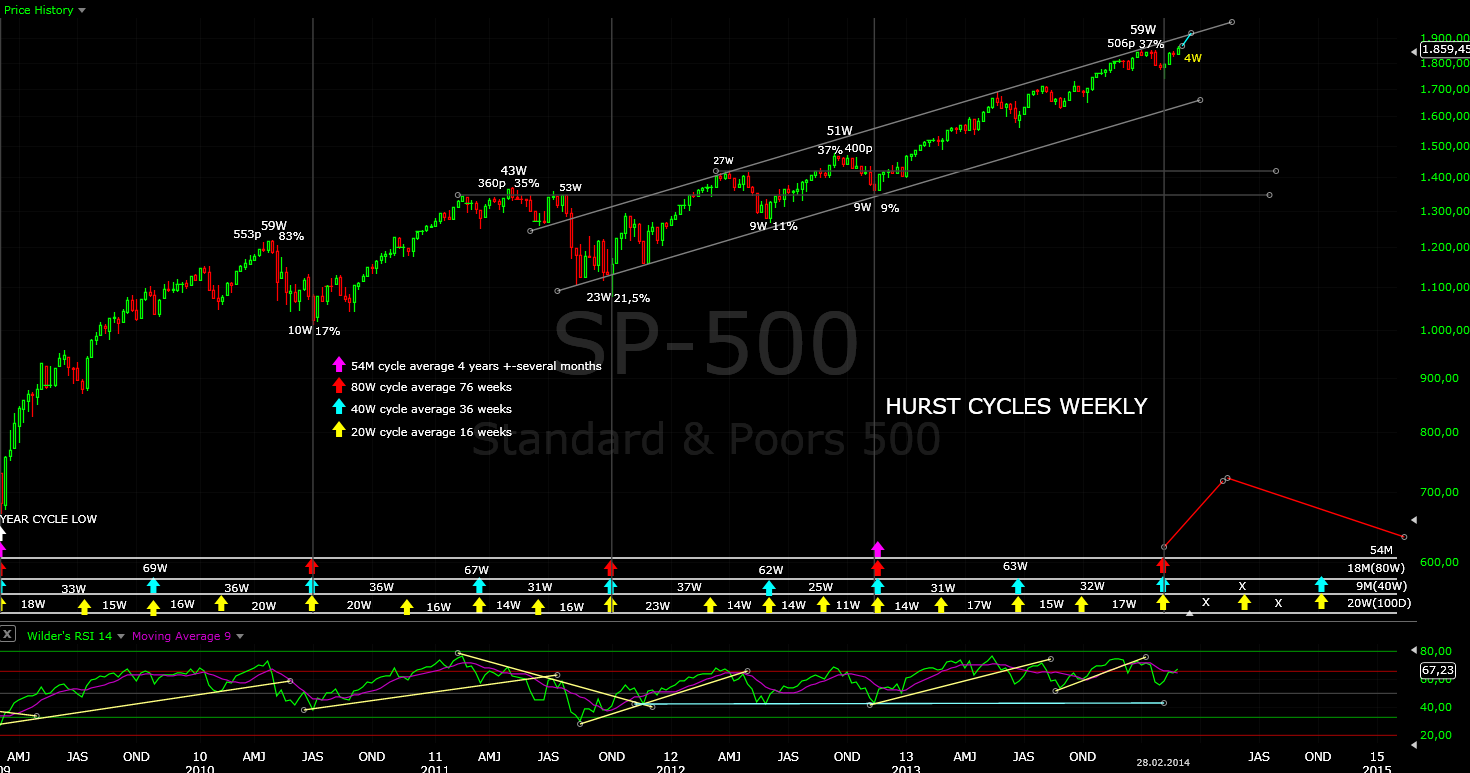

HURST CYCLES
This is the perfect time to see a 20 day cycle top and a pullback...
4 weeks higher this should be the next 20 week cycle, that is why I expect the move higher to last few more weeks.


Tom Demark SEQUENTIAL AND COUNTDOWN - this technique spots areas of exhaustion.
(mistake corrected on the weekly chart 13 is now... it happens when you count by hand:)
The Demark charts are interesting - we have finished combo countdown on the weekly and the monthly chart. This are the most powerful signals when you see counts finishing in different time frames and this time this is weekly and monthly - I THINK THIS IS IMPORTANT.
If you use the less restricted rules we have 13 on both time frames. If we use the restricted rules weekly is at 11 and monthly at 12. So there is a room for 2-3 weeks or one monthly bar more to the upside.
Beside the counts do you see the wedge - there is no more room to move inside it. Two options it breaks lower with first stop 1600 support and MA20 or it breaks higher we see a parabola of a parabola:)