Oct 30, 2021

Weekly preview

Reached the time target for 10w high. More and more it looks like part of Z-wave and 4y cycle high.

The last chart is DJ showing late September was 20w low. In this case the indices are heading into 20w high and this high will complete the sixth 40 week cycle from the Jan.2018 top or 4 year cycle high. jpnor asked about the first half of December - well this is the case for major top.
If you are bullish pray for the markets to decline below the September low.


TRADING
Trading trigger - buy signal. Reached the average length for 10w high.
Analysis - sell the highs, the market is near a major top.

P.S. - for a trade both analysis and trigger should point in the same direction.


TECHNICAL PICTURE and ELLIOTT WAVES
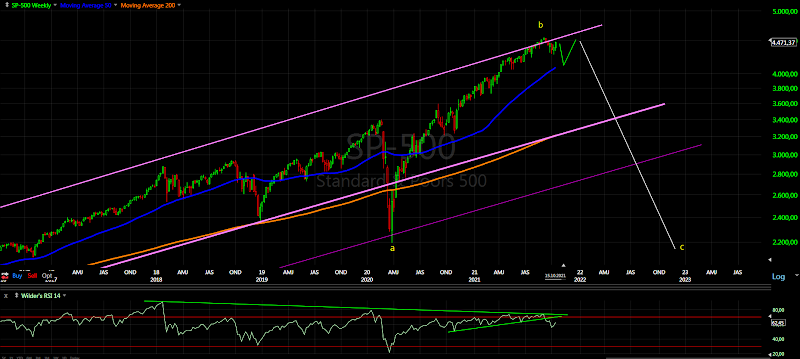
Short term - for B-wave we need to see sharp reversal... I doubt it. More likely we are in c/Z.


Intermediate term - It looks more and more like W-x-Y-x-Z structure three zig-zags from the March.2020 low with roughly the same length in time.
Testing the broken trend line with RSI divergences daily and weekly.


Long term - topping process running for months and maturing. Some kind of b-wave and c-wave will follow.
Some perspective for those with the 5500 fantasy... it is just getting started for sure.... all sheeple with the same target - one says baaa and all the others repeat.


MARKET BREADTH INDICATORS
Market Breadth Indicators - signs of weakening, at least short term top.
McClellan Oscillator - loer high and ready move below zero.
McClellan Summation Index - buy signal.
Weekly Stochastic of the Summation Index - buy signal.
Bullish Percentage - topping below 70?
Percent of Stocks above MA50 - looks lie topping below 75.
Fear Indicator VIX - higher low so far... double bottom.
Advance-Decline Issues - lower high and heading lower.


HURST CYCLES
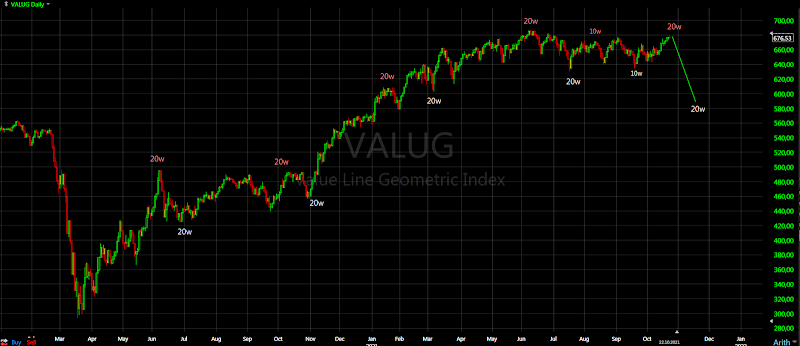
Short term cycles - NDX more clear picture 4x20d cycles 8 weeks for 10w high. In the next days we should see turn into 10w low.


Long term I am expecting 4 year cycle high. At the moment it is very difficult to pinpoint the 18m cycle low...
Week 4 for the 20w cycle? Was late September 20w low?? or even 18m low??? like this (DJ):

Oct 23, 2021

Weekly preview

Higher to complete at least 10w high. This is the bullish case 10w high and b-wave. If not it is 20w high and possible top from the March.2020 low. The size of the next decline will be important.


TRADING
Trading trigger - buy signal. We have the minimum for 10w high 35 days.
Analysis - sell the rips, long topping process.

P.S. - for a trade both analysis and trigger should point in the same direction.


TECHNICAL PICTURE and ELLIOTT WAVES
Short term - a B-wave from a flat or worse another zig-zag of a bigger corrective structure to complete the move from the March low.


Intermediate term - from the March low we have one big zig-zag consisting of two zig-zags, which itself consist of zig-zags. You can call it W-X-Y, but there is no impulses.
Testing the broken trend line.


Long term - topping process running for months and maturing. Some kind of b-wave and c-wave will follow.


MARKET BREADTH INDICATORS
Market Breadth Indicators - the same like last week.
McClellan Oscillator - above zero, looks like double top.
McClellan Summation Index - buy signal.
Weekly Stochastic of the Summation Index - buy signal.
Bullish Percentage - moving higher.
Percent of Stocks above MA50 - moving higher.
Fear Indicator VIX - higher low so far... double bottom.
Advance-Decline Issues - lower high so far, looks like topping.


HURST CYCLES
Short term cycles - a few more days were needed to complete 20d cycle high and we have them this week. This should be at least 10w high.


I have shown this chart a few weeks ago - looking at some indices like NYSE,XLF you can make the case that this is 20w high. The outcome should be the same - decline into 20w low. The difference is what happens after that.
And the same with NYSE

Oct 16, 2021

Weekly preview

The triangle was negated and it looks very messy:) We know that the indices are heading into 10w high, the pattern I think it is B-wave better visible if you look at NYSE/DJI.


TRADING
Trading trigger - buy signal, higher into 10w high confirmed.
Analysis - sell the rips, long topping process.

P.S. - for a trade both analysis and trigger should point in the same direction.


TECHNICAL PICTURE and ELLIOTT WAVES
Short term - not clear..... intermedite term I think it is a B-wave.


Intermediate term - from the March low we have one big zig-zag consisting of two zig-zags, which itself consist of zig-zags. You can call it W-X-Y, but there is no impulses.
Look at NYSE/DJI - from mid-August I see zig-zag lower A and zig-zag higher B all this two months or 10 weeks high-to-high.


Long term - topping process running for months and maturing. Some kind of b-wave and c-wave will follow.


MARKET BREADTH INDICATORS
Market Breadth Indicators - turned up.... reversal?
McClellan Oscillator - above zero.
McClellan Summation Index - buy signal.
Weekly Stochastic of the Summation Index - buy signal.
Bullish Percentage - in the middle of the range.
Percent of Stocks above MA50 - in the middle of the range.
Fear Indicator VIX - in a range for a long time.
Advance-Decline Issues - moving higher, lower high so far.


HURST CYCLES
Short term cycles - for the moment sticking with this model. In the next days we should see 10w high.


Week 12 for the 20w cycle. Long term I am expecting 4 year cycle high. Intermediate term two options and I think the bullish one is more likely:
- bullish 40w/18m cycle low in November with one extra 20w cycle - time adjusting for the missing one from 2020.
- bearish the 18m low was in July which means decline into 20w low only.

Oct 9, 2021

Weekly preview

After 10w low in September now watching for 10w high in October. Last week I have shown triangle because it makes most sense from cycle point of view - completed pattern for a cycle low followed by another pattern completing for the corresponding cycle high.


TRADING
Trading trigger - buy signal. 10w high is expected and this is what the MA10 trigger is showing.
Analysis - sell the rips, long topping process.

P.S. - for a trade both analysis and trigger should point in the same direction.


TECHNICAL PICTURE and ELLIOTT WAVES
Short term - triangle B-wave seems the most likely scenario so I continue to watch it as my primary pattern.


Intermediate term - from the March low we have one big zig-zag consisting of two zig-zags, which itself consist of zig-zags. You can call it W-X-Y, but there is no impulses.
It seems price is consolidating below the broken trend line and MA50.


Long term - topping process running for months and maturing. Some kind of b-wave and c-wave will follow.


MARKET BREADTH INDICATORS
Market Breadth Indicators - bounced higher this week. No change in the big picture the indices should be in the middle of intermediate term correction.
McClellan Oscillator - above zero.
McClellan Summation Index - sell signal.
Weekly Stochastic of the Summation Index - sell signal.
Bullish Percentage - bounce higher.
Percent of Stocks above MA50 - bounce up rom the 25 level.
Fear Indicator VIX - nothing interesting.....
Advance-Decline Issues - in the middle of the range around zero.


HURST CYCLES
Short term cycles - no surprises we have the 20d low on day 9 or 10 depends on if you look at futures or cash index. Now close/at 20d high... next week we should see decline into 20d/5w low.


Week 11 for the 20w cycle. Long term I am expecting 4 year cycle high. Intermediate term two options and I think the bullish one is more likely:
- bullish 40w/18m cycle low in November with one extra 20w cycle - time adjusting for the missing one from 2020.
- bearish the 18m low was in July which means decline into 20w low only.

Oct 2, 2021

Weekly preview

The indices closed the month at the low showing weakness, most likely we saw short 5w high only three weeks.
Short term it is difficult to say what exactly is going on - in the middle of something, more price action is needed.
Intermediate term the weakness is a hint that something is pushing the price lower. I think this are the longer term cycles and the indices turned lower into 20w low and this low is likely to be 18m low too.


TRADING
Trading trigger - sell signal.
Analysis - sell the rips, long topping process.

P.S. - for a trade both analysis and trigger should point in the same direction.


TECHNICAL PICTURE and ELLIOTT WAVES
Short term - in the middle of something... difficult to say, another zig-zag decline. On the chart is shown triangle for 10w high.
Other guesses - diagonal https://invst.ly/w6ipp | double zig-zag https://invst.ly/w6iui


Intermediate term - from the March low we have one big zig-zag consisting of two zig-zags, which itself consist of zig-zags. You can call it W-X-Y, but there is no impulses.
Here it is how studyofcycles sees impulses... it does not matter how you count W-X-Y, at the end it is the same.


Long term - topping process running for months and maturing. Some kind of b-wave and c-wave will follow.


MARKET BREADTH INDICATORS
Market Breadth Indicators - turned lower again, the indices should be in the middle of a decline.
McClellan Oscillator - around zero.
McClellan Summation Index - sell signal.
Weekly Stochastic of the Summation Index - sell signal.
Bullish Percentage - in the middle of the range.
Percent of Stocks above MA50 - touched oversold level.
Fear Indicator VIX - nothing interesting....
Advance-Decline Issues - in the middle of the range.


HURST CYCLES
Short term cycles - it seems we have short 5w cycle high. Possible 20d low at day 9 on Friday unless we see sharp decline on Monday. Next we should see a few days higher for 20d high.


Week 10 for the 20w cycle.
Long term - last week I have explained that I see 4 year cycle high.
Intermediate term two options and I think the bullish one is more likely:
- bullish 40w/18m cycle low in November with one extra 20w cycle - time adjusting for the missing one from 2020.
- bearish the 18m low was in July which means decline into 20w low only. It is bearish because the second 18m cycle is breaking already below the low of the previous one, which means the 4y cycle turned lower.