Trading trigger - buy signal, higher into 10w high confirmed.
Analysis - sell the rips, long topping process.
P.S. - for a trade both analysis and trigger should point in the same direction.

TECHNICAL PICTURE and ELLIOTT WAVES
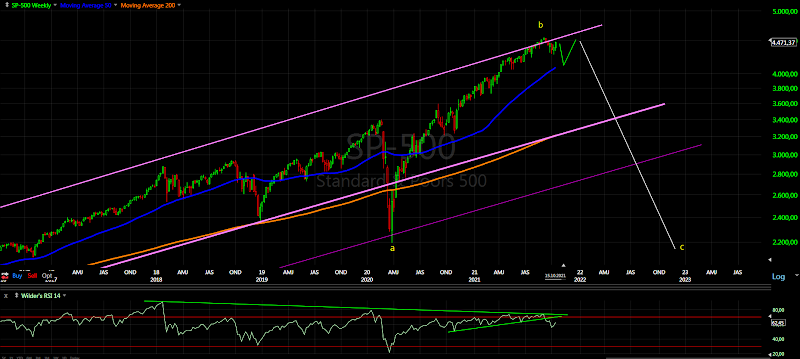
Short term - not clear..... intermedite term I think it is a B-wave.

Intermediate term - from the March low we have one big zig-zag consisting of two zig-zags, which itself consist of zig-zags. You can call it W-X-Y, but there is no impulses. Look at NYSE/DJI - from mid-August I see zig-zag lower A and zig-zag higher B all this two months or 10 weeks high-to-high.

Long term - topping process running for months and maturing. Some kind of b-wave and c-wave will follow.
MARKET BREADTH INDICATORS
Market Breadth Indicators - turned up.... reversal?
McClellan Oscillator - above zero.
McClellan Summation Index - buy signal.
Weekly Stochastic of the Summation Index - buy signal.
Bullish Percentage - in the middle of the range.
Percent of Stocks above MA50 - in the middle of the range.
Fear Indicator VIX - in a range for a long time.
Advance-Decline Issues - moving higher, lower high so far.
HURST CYCLES
Short term cycles - for the moment sticking with this model. In the next days we should see 10w high.

Week 12 for the 20w cycle. Long term I am expecting 4 year cycle high. Intermediate term two options and I think the bullish one is more likely:
- bullish 40w/18m cycle low in November with one extra 20w cycle - time adjusting for the missing one from 2020.
- bearish the 18m low was in July which means decline into 20w low only.

I was wondering where is the impulse for c/B - https://ibb.co/j4PsWDG
ReplyDeleteThe right shape and size for expanded flat. I have never seen expanding ED lets see if it plays out.
Myself, I have been patiently watching a beautiful WEEKLY set-up of price/indicator divergences (RSI, MACD, ROC, Stochastics, Force Index, %B, etal) on ALL indices but Russell2K. Licking my chops if price gets anywhere near the prior high (September) on the weekly charts, and fails. Classic longer-term sell scenario. Fingers crossed that prices rise for another week or two.
DeleteI think it's a B wave as well, but who knows when C arrives. This could take several weeks and I should probably expect that at this point :(
ReplyDelete