Trading trigger - sell signal, we should see soon intermediate term low.
Analysis - long term sell the rips, close to potential major top. Intermediate term close to intermediate term low. Trades depending on your time frame.
P.S. - for a trade both analysis and trigger should point in the same direction.

TECHNICAL PICTURE and ELLIOTT WAVES
Short term - no new information so the same patterns.... looking at RSI daily it should be an a-b-c pattern from the November high. Part of what is this a-b-c, b/Z or something else is more difficult question.

Intermediate term - I see three zig-zags with roughly the same length in time W-x-Y-x-Z or possible W-x-Y with complex double zig-zag for Y. Struggling below MA200 and the trend line not so bullish. Bearish(red) and bullish(green) outcome shown for the coming bounce.

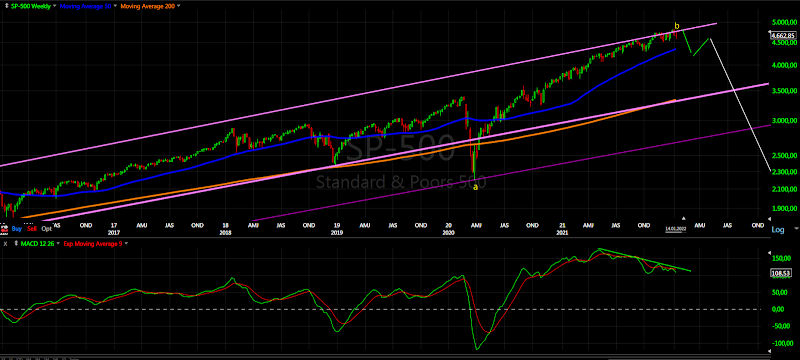
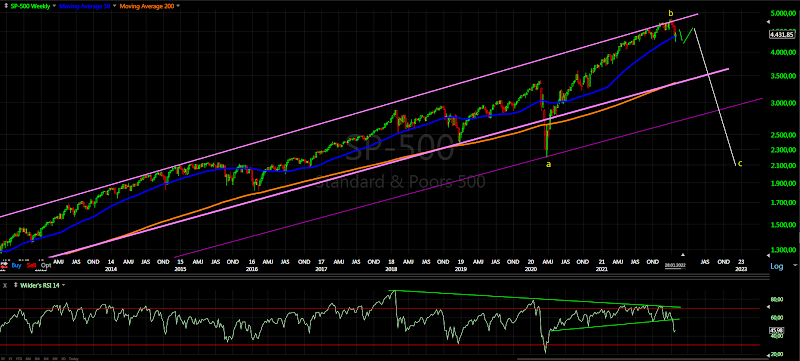
Long term - topping process running for months and maturing. Some kind of corrective wave b-wave and c-wave will follow.
MARKET BREADTH INDICATORS
Market Breadth Indicators - the same like last week, the indices should be close to a low, but there is room for another decline.
McClellan Oscillator - bounce from oversold level.
McClellan Summation Index - sell signal.
Weekly Stochastic of the Summation Index - sell signal.
Bullish Percentage - levels where usually an intermediaterm low is seen.
Percent of Stocks above MA50 - nearing oversold levels.
Fear Indicator VIX - higher low followed by higher high... trend reversal???
Advance-Decline Issues - oversold level reached the sell off is showing strength.
HURST CYCLES
Short term cycles - it looks like second 20d cycle high for 5w high. After that we should see something like one week lower for 10w low(probably 20w low too).

Week 17 for the 20w cycle. Long term I am expecting 4 year cycle high. The 18m low either late September with one extra 20w cycle or alternate on time in June/July... waiting to see how the pattern will play out to confirm one of the two options.