Jan 28, 2017

Weekly preview

Short term view - more to the upside, waiting for the completion of the current move higher.
Intermediate term view - after the move higher is finished expect correction for a few weeks.

The indexes spiked higher.... someone surprised:) Now waiting for the move higher to be completed. After that we should see at least 2-3 weeks correction for 20 week cycle low, but looking at market breadth it could be something much bigger(the pattern which I discussed last week).


TECHNICAL PICTURE and ELLIOTT WAVES
Short term - so far the pattern does not look finished waves 4 and 5 are missing. Target - still waiting to see waves 3 and 4 for accurate target... I am seeing something between 2330-2350. Time - another 1 week max 2.
Now we have a new support area+MA50 - below this level I am wrong.


Intermediate term - I would say the indicators and market breadth favor the bearish scenario. Usually you do not see such divergencies(RSI/MACD) in iii of 3. The divergencies start building between iii and v of 3 and than follows double divergence with the top at wave 5.


Long term - no change, waiting for the wave from Feb.2016 to be finished.


MARKET BREADTH INDICATORS
The Market Breadth Indicators - short term the indicators are getting ready for reversal signal. Double divergences on some indicators suggesting that we could see something more bearish than most expect.
McClellan Oscillator - more lower highs.
McClellan Summation Index - still buy signal.
Weekly Stochastic of the Summation Index - it could turn lower any moment.
Bullish Percentage - starts turning lower.
Percent of Stocks above MA50 - weak and struggling to stay above 75 despite the new highs.
Fear Indicator VIX - heavily beaten down. A lot of complacency and very tight BB. The surprises for the indexes will be to the downside not to the upside.
Advance-Decline Issues - in the middle of the range.


HURST CYCLES
Day 18 of the second 40 day cycle for the 20 week cycle.

Week 12 of the 20 week cycle... the indexes should make a top in the next 1-2 weeks.


Tom Demark SEQUENTIAL AND COUNTDOWN - this technique spots areas of exhaustion.
Day 4 of a setup... it will be interesting if it will be finished. Than we will have a finished 9-13-9 on the daily and weekly chart.

Jan 21, 2017

Weekly preview

Short term view - final spike higher.
Intermediate term view - after the final move higher correction for a few weeks.

I thought we will see more action after MLK day... no the sideway move continues and the analysis has not changed.

I wrote many times that the pattern is ambiguous. It is easy to say it is moving higher it is so bullish iii of 3 of III.... but I can not get rid of this feeling that the move since Feb.2016 has corrective DNA. That is not all, there is too many red flags - some divergences on the weekly charts, market breadth indicators with double divergencies, TomDemark 9-13-9 finished on the weekly chart. You do not see such conditions in iii of 3 rather when you expect correction... bigger one 10% not just pullback 3%-5%.
The market does not make a top with an A-B-C move higher... so which pattern has corrective DNA, but ends as an impulse? Which pattern will allow 200 points drop followed by another ATH?
The pattern which satisfies all conditions is expanding ending diagonal. It is shown on the second chart and on the last chart DAX it is even better visible.
I would say right away this is the pattern if it was not so crazy 10% lower followed by 25% higher:) Now I am waiting and I am very curious what will happen in the February-March-April time frame.


TECHNICAL PICTURE and ELLIOTT WAVES
Short term - the same like last week except that the bearish case(red) has much lower probability now(it was not my favorite anyway). After the last top it is difficult to see impulsive reversal.


Intermediate term - the bullish pattern is clear the price should move higher in series of iii-iv/3-4. The difference between the two is how wave 4 and the 18 month cycle will look like. The new pattern(red) suggest very bearish February-April time frame followed by final mania phase 25% higher for the last wave... exactly what you want to see for an important bull market top.
As a trader I pray that it plays out, with the sideway move(green) you can not squeeze a lot of profits.


Long term - no change, waiting for the wave from Feb.2016 to be finished.


MARKET BREADTH INDICATORS
The Market Breadth Indicators - the same like last week. Short term no reversal signs, but double divergences on some indicators suggesting that something bearish is around the corner.
McClellan Oscillator - a third lower high will look great for double divergence.
McClellan Summation Index - buy signal.
Weekly Stochastic of the Summation Index - buy signal, in overbought territory for a while.
Bullish Percentage - buy signal.
Percent of Stocks above MA50 - showing weakness already, one lower high for short term divergence will look great.
Fear Indicator VIX - very tight BB again and complacency.... volatility will rise soon.
Advance-Decline Issues - in the middle of the range, one final spike to overbought territory will look good for a top.


HURST CYCLES
Day 13 of the second 40 day cycle.

Week 11 of the 20 week cycle... the indexes should be nearing a top.


Tom Demark SEQUENTIAL AND COUNTDOWN - this technique spots areas of exhaustion.
9-13-9 finished two weeks ago, but no price flip so far.... no sell signal.


The same pattern for the DAX - it is even better visible. We see series of expanding a-b-c moves. It looks much better than some iii of 3 of III count.

Jan 14, 2017

Weekly preview

Short term view - final spike higher.
Intermediate term view - after the final move higher correction for a few weeks.

Boring week with sideway price action. We saw a small move lower and the final move higher should be around the corner. Overall for a month since mid-December the price moves in a tight range and time is running out.... volatility should rise soon and either we will see final spike higher or the price will reverse lower.

A month ago I have shown different US indexes... they are moving as expected, which does not really help us:). Nasdaq looks like finished impulse from the November low, SP500/NYSE mixed could be counted as finished or could extend a little bit higher, DJI,DJT,RUT,XLF - I do not see a way to count this as a reversal it should be wave 4 with one final spike higher before a bigger pullback.
As I wrote last week I favor the scenario with the indexes moving higher before a reversal.... next week we should have our answer.


TECHNICAL PICTURE and ELLIOTT WAVES
Short term - move higher(green) expected, but watch the support line. The price has nothing to do below support,the gap and MA200. Below this level something bearish(red) has started.


Intermediate term - no change waiting to see how a correction will look like. RSI either it rises from the trend line for a top with a divergence or accelerates and breaks below the trend line. The same for MACD - either it rises for a top with a divergence or it accelerates lower.


Long term - no change, waiting for the wave from Feb.2016 to be finished.


MARKET BREADTH INDICATORS
The Market Breadth Indicators - the same like last week. Short term no reversal signs, but double divergences on some indicators suggesting that something bearish is around the corner.
McClellan Oscillator - making lower highs.
McClellan Summation Index - buy signal.
Weekly Stochastic of the Summation Index - buy signal, in overbought territory for a while.
Bullish Percentage - buy signal, but double divergence.
Percent of Stocks above MA50 - second high still buy signal above 75, but double divergence.
Fear Indicator VIX - very tight BB again and complacency.... volatility will rise soon.
Advance-Decline Issues - one more push to overbought levels will look better.


HURST CYCLES
Day 9 of the second 40 day cycle.

Week 10 of the 20 week cycle... indexes should be nearing a top.


Tom Demark SEQUENTIAL AND COUNTDOWN - this technique spots areas of exhaustion.
9-13-9 finished last week, but no price flip so far.... no sell signal.

Jan 7, 2017

Weekly preview

Short term view - I expect more to the upside.
Intermediate term view - after a top in January I expect a bigger correction in February.

We had a small pullback and 40 day cycle low as expected. Now waiting for the current move higher to be finished in January and the top of the 20 week cycle.

The pattern from February 2016 is not clear, it is ambiguous. Most indexes favor bullish EW pattern, but some like NYSE and Nasdaq look more bearish. All other signs are bearish and suggest something bigger to the downside - divergences on the weekly chart, market breadth indicators with double divergences, 20 week cycle top, TomDemark 9-13-9 finished on the weekly chart.
So think and act as a trader, which means follow the market step by step until we have more clear pattern. Now waiting to see first the move higher in January then the move lower in February before trying to guess the pattern.


TECHNICAL PICTURE and ELLIOTT WAVES
Short term - the trend line was broken and we had the pullback lower. We saw already small impulse higher with higher high. This is enough to have a finished pattern, but it is more likely that the move continue higher. Watch the red line - if the price moves below it, with very high probability we have reversal lower.


Intermediate term - for the SP500 you can make the case for possible A-B-C(red), but if you look at other indexes bullish impulse(green) looks better (see the last chart).


Long term - most indexes favor impulse as a pattern... if this is III or V is another story.


MARKET BREADTH INDICATORS
The Market Breadth Indicators - short term no reversal signs, but double divergences on some indicators suggesting that something bearish is around the corner.
McClellan Oscillator - making lower high.
McClellan Summation Index - buy signal.
Weekly Stochastic of the Summation Index - buy signal, in overbought territory for a while.
Bullish Percentage - buy signal.
Percent of Stocks above MA50 - second high still buy signal above 75.
Fear Indicator VIX - very tight BB again and low values. Volatility will rise soon.
Advance-Decline Issues - one more push to overbought levels will look better.


HURST CYCLES
It looks like we have finished 40 day cycle at day 38 and the next one is running at day 4.

Week 9 of the 20 week cycle... in the next 1-2 weeks we should see the top and the cycle should turn lower.


Tom Demark SEQUENTIAL AND COUNTDOWN - this technique spots areas of exhaustion.
We have finished 9-13-9 on the weekly chart. Waiting for a price flip and reversal.


DJI looks much better as an impulse. Other indexes like RUT, DAX, DJT show similar pattern.

Jan 2, 2017

Long term - update

Happy New Year!!!!


I hope you had pleasant holidays and recharged the batteries. I wish you great trades in 2017:) and very successful year!!!


It is time for the next long term update. There is no huge surprises - stocks are higher, bonds high probability that the bull market is over, PM are correcting, energy sector stronger than expected, only the USD surprised a little bit it broke out of the range 1-2 months earlier and it does not look like a triangle now.

When I look at the markets I see the same message from USD,stocks,Bonds,PM charts - we need one counter trend move and one more move in the direction of the current trends before they are finished. At the moment I expect this moves to develop in Q1/Q2 of 2017 and later in Q2 should start the transition from "risk on"(stocks,USDJPY) trade to "risk off" (PM,Bonds) trade.


- STOCKS
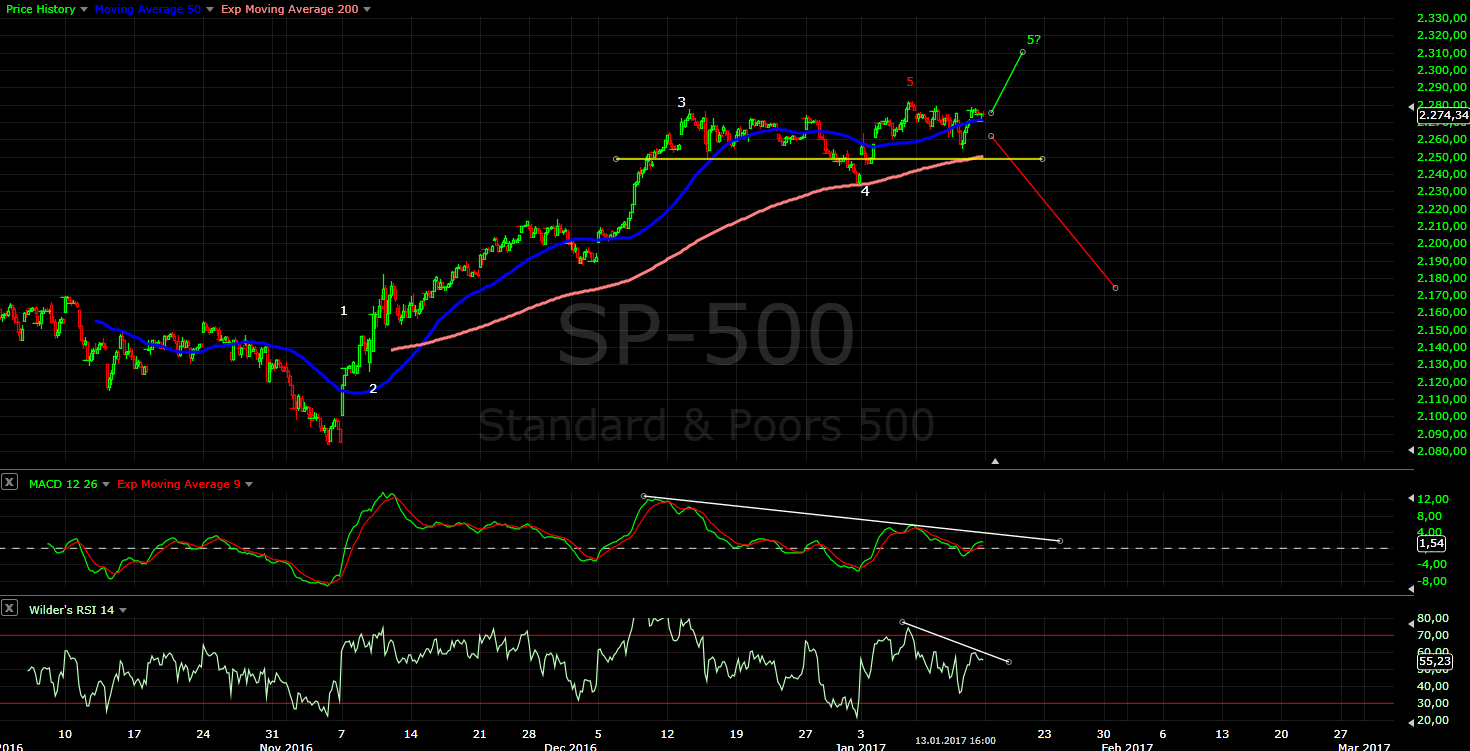
The indexes continue moving higher. If you count the move from February as corrective than the bull market is definitely not over(a trend does not end with correction higher) and if you count it as impulse after a correction in Q1 it should continue higher in Q2. So in the next 6 months I am not mega bearish, I will just follow the market.

I am not sure if this is an impulsive wave, but I do not see a finished pattern either. So I expect more to the upside. Currently I follow this long term chart and later it will be adjusted if necessary.


Cycle analysis - both analysis peak-to-peak and trough-to-trough seem to work fine and show similar picture average 7 year cycle with length 6.5 to 7.5 years and the shorter cycle 3 to 4 years.

Trough-to-trough analysis - the next important lows in H2 2019 and 2022-2023.


Peak-to-peak analysis - the next important high is in late 2018.


- BONDS
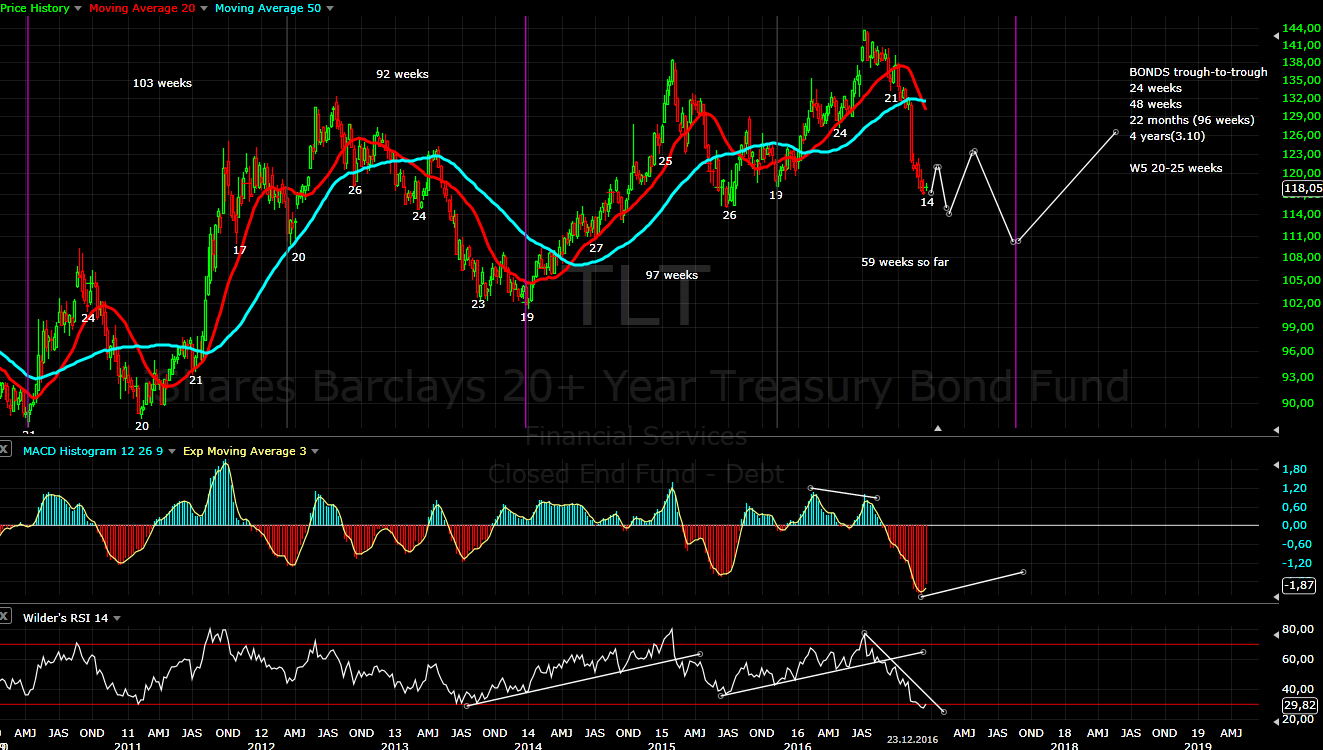
I was expecting a secular top for the bond bull market and we have really powerful move lower. It looks like impulse and we should nearing the bottom of wave 3. In the next 6 months we should see wave 4 and 5 lower.

Weekly cycle chart - EW points to wave 4 and 5, the cycle says we need another 6-7 months for important 3,5 year cycle low.

Below long term cycle charts - both analysis peak-to-peak and trough-to-trough seem to work. The cycle runs between 3,5-4 years.

Trough-to-trough analysis - the next important low is expected in Q3 2017


Peak-to-peak analysis - I think we have secular top behind us.
The next important peak is around Q4 2019/Q1 2020 at this time the indexes should make their 4 year cycle low... just a coincidence:)


- FOREX
The USD was looking for a long time like a triangle, but it broke out higher. The big picture has no changed the sideway move was wave 4 as expected and currently the USD is in iii of 5 so we are waiting for waves iv and v of 5 in Q1 and Q2 2017. The top of this wave should be a major 16 year cycle top.

P.S. interesting is if you look at USD long term chart you will see very nice rhythm 7 years lower (1985-1992/2001-2008) 9 years higher (1992-2001/2008-2017?) It looks like after a top in 2017 it is time for the next 7 years lower.

EURUSD is mirror image of the USD. The final wave lower is running before a major 16 year cycle low. Chart from SilentOne.

USDJPY is interesting for risk on/risk off trade and PM which have very high inverse correlation. In the previous post I wrote to expect 4 year cycle low and move higher - there we have it... surprisingly strong. Such strong moves (right translated cycles) usually are followed by another higher high (M pattern) and reversal. The cycle analysis and EW support it so I expect a pullback and another higher high in Q2 before a reversal.
In the previous two posts I have shown long term peak-to-peak and trough-to-trough analysis with 8-9 year long cycles. Now closer look the last 8 years.

Peak-to-peak the shorter cycles are with length 1 year(12-13 months). Currently we are in the middle of such a cycle and the top should be in June-July 2017.

Trough-to-trough similar picture length 1 year (11-12 months). Currently week 18 of the first 24 week cycle. Strong right translated move so I expect the second 24 week cycle to make higher high before turning lower for yearly cycle low.


- GOLD/SILVER/MINERS
I was expecting PM sector to squeeze one more move higher and then to correct lower. That is exactly what happened... now we are searching for the bottom. Long term I think the sector is in secular bear market and currently we are in cyclical bull market for a few years.

The problem with the bottom is the move lower looks like finished double zig-zag, but cycles and inter market correlations say the bottom should come later next year. I think it will be some kind of a sideway move with higher low this scenario fits better.

Long term peak-to-peak analysis. Commodities move roughly 10 years higher and 20 years lower. For me 2011 is secular top 2001-2011 were this 10 mega bullish years. Currently this should be cyclical bull market until late 2018.

The next important low should be around July 2017. Around this time bonds should make important low and USDJPY important top.... is this a coincidence? I doubt. It is way too early for a bottom... one option is lower low, another we will see a sideway move before PM blasting higher for the next leg of this cyclical bull market.

The EW count - I have already posted counts with a double zig-zag. Now this double zig-zag is finished, but cycles says it too early. The two options I see are sideway move with higher low (yellow 1-2) or we have impulse lower(red - sideway/higher for 2-3 months) which will make a lower low and finish the bear market from 2011.

Gold miners are stronger. The double zig-zag is well visible, but again the 18 month cycle low should be later in March 2017.

This is a screenshot from SilentOne's webinar cycle analysis PM and gold miners with EW annotations from me. I am trading the gold miners that is why I am analyzing PM at all and the chart below is very interesting.

BMGI index long term chart of gold miners. We have 14-15 year cycle bottom-to-bottom. Since 1971 the USD is no more coupled to gold and the moves are very volatile. What I see except that it is very difficult to predict the pattern:)
- In one 15 year cycle there is two moves higher and two moves lower.
- there is more to the upside in the next few years. Gold miners just made 15 cycle low and this they are still in this first move higher.
- there is more to the downside after the move higher is finished. I do not think 5 years correction(2011-2016) is long enough to correct 40 years move (1971-2011)

EW - I think we have huge A-B-C. You can argue that the top of wave C was in 2008 and we have expanded flat finished in 2016, but I do not think this changes the big picture. I think the next major low will be around 2030-2031 when gold makes secular bottom (this 20 years lower for a commodity cycle) and 20 years correction for 40 years move higher looks better than 5 years. In this case we should expect corrective wave B or X for several years probably some kind of a zig-zag (two moves higher in a 15 year cycle).


- CRUDE OIL/NATGAS
The energy sector was stronger than expected. I was expecting a zig-zag, but the move was more a sideway/upward move. Thanks to posts from SilentOne now I have working cycle models for Crude Oil and Natgas and the analysis should be better:)

The longer term forecasts has not changed - commodities move roughly 10 year higher and 20 years lower. The 10 year higher are behind us and secular bear market is running. Currently in cyclical bull market - crude oil should move higher for another 2-3 years, but with corrective waves. Below long term charts with cycles.

Peak-to-peak cycle analysis.

Trough-to-trough cycle analysis.

Now we should see a move lower then higher and another move lower.... I think 2017 will be difficult to trade Crude Oil. I suspect we will see wave B sideway move....


Natgas - much stronger than expected, but now I think I know why:) - peak-to-peak analysis is working like a clock and this strong move should be 11 year cycle high. It has very accurate sub-cycle length 2 year and 8-10 months. This is the fourth cycle from the top in 2005 and it should be an important top. So rough year 2017 for Natgas too it should move lower most of the time.


- VOLATILITY
For real speculators who are not scared to take a risk and make big money:) Charts which will help you to trade XIV/UVXY(TVIX).

You can trade the corrections, but once per year XIV makes important low and this is the time to make a big bet.... of course the indexes should be in a bull market.

UVXY(TVIX) - I think the time to trade it is only once every 60-70 months. The move develops as two legs higher. It is more secure to trade the second leg when the correction for the indexes is in full force and there is fear. Next we should see a bigger correction 18 month cycle low next year and the time is approaching if you want to trade long volatility.