Dec 29, 2018

Weekly preview

One more low on Monday for a wave with 1,618 Fibo extension and reversal higher.... someone surprised? I think we have a-b-c for w4 and one more lower low will look better. If you think the bottom is in and start projecting impulse higher it will be too large moving too fast - in 2-3 weeks 2700, pause 1-2 weeks and new ATH in February or testing the highs for wave c/B. This is unrealistic.

Intermediate term - everybody so smart major top and the bull market is over. I would say bullshit, bear markets do not start this way. There is two options - the high was in September and currently in A of A-B-C alternate the top was in January and we have big corrective A-B-C currently in C with shorter 4 year cycle. Market breadth pushed to extremes only comparable with important lows.... and if you take several indicators as a combination the only possible comparison is the bottoms in 2002 and 2008. This is not the beginning of a bear market this is the end of something.


TECHNICAL PICTURE and ELLIOTT WAVES
Short term - wave 3 with 1,618 extension and two legs higher with the same size(zig-zag) hitting 2520... just a coincidence my target:) There was a question if TA still works - after this week we have a clear answer.
What if the price continue higher? No clue it does not fit much in the big picture... maybe wave b of a triangle.


Intermediate term - one more lower low will look much better for a complete pattern with divergences.


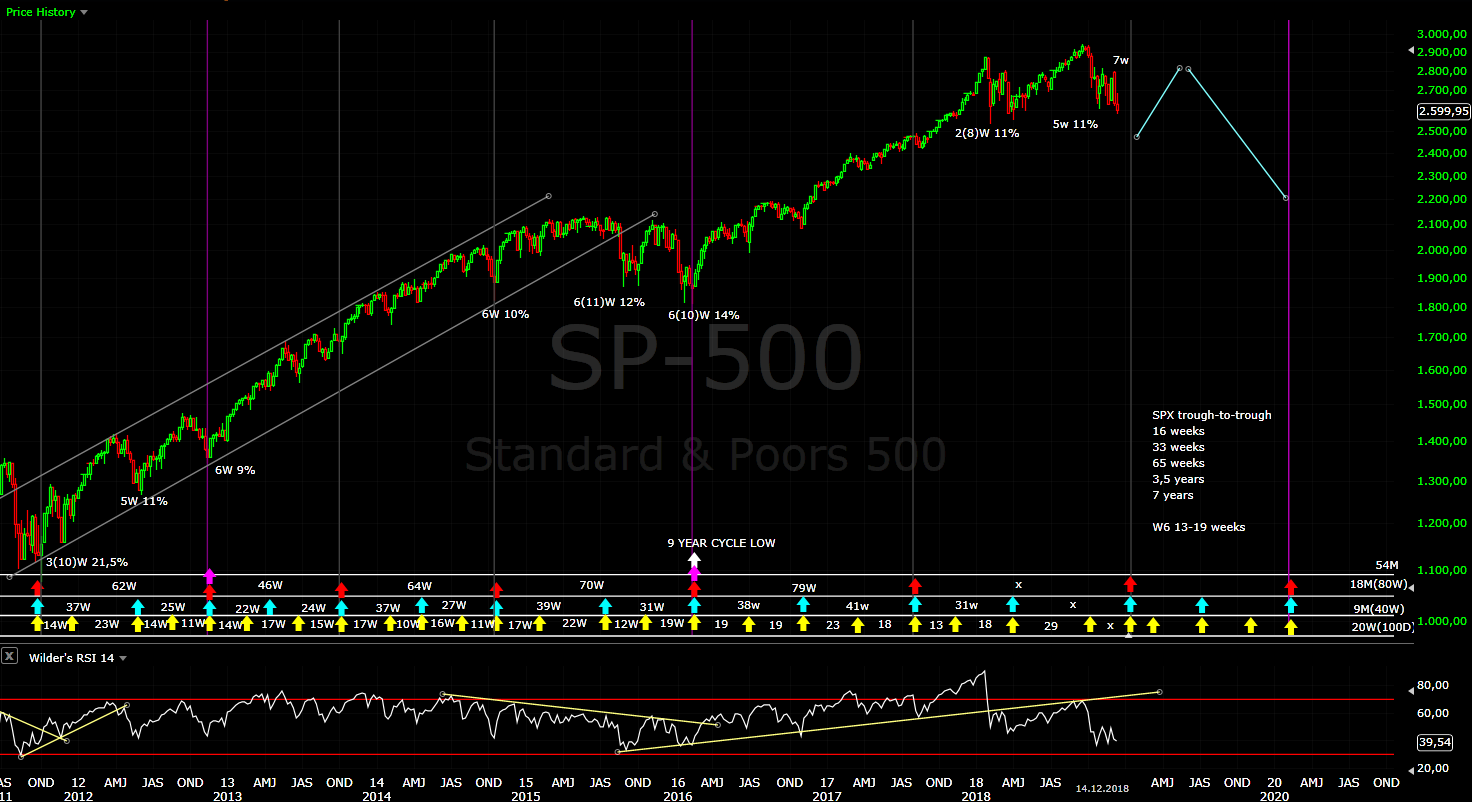
Long term - for me corrective move A-B-C is running and the only question is when it has begun in January or September. If the alternate scenario(green labels) is running we should see impulse for C, so instead of the current a-b-c we have 1-2-3.


MARKET BREADTH INDICATORS
Market Breadth Indicators - pushed to extreme levels usually seen at important lows.
McClellan Oscillator - extreme oversold and resetting.
McClellan Summation Index - sell signal, extreme oversold.
Weekly Stochastic of the Summation Index - sell signal, reached oversold territory.
Bullish Percentage - extreme oversold.
Percent of Stocks above MA50 - extreme oversold and turned up.
Fear Indicator VIX - exploded to 36 on Monday.
Advance-Decline Issues - oversold and turned up.


HURST CYCLES
Day 23 for the daily cycle.


Week 9 for the 20 week cycle.


Tom Demark SEQUENTIAL AND COUNTDOWN - this technique spots areas of exhaustion.
Here we go again the next setup interrupted at 8. The bears just can not push lower long enough to finish a setup despite all the selling. Trend means trending moving steadily in one direction. Not a single setup in the last three months. Again no confirmation for trending market.

Dec 22, 2018

Weekly preview

Last week I have explained why the markets are in bearish mode and in bearish mode shit happens:) The indexes took the short cut and just plunged lower. The explanation is simple we do not have zig-zag Y it is impulse wave C namely bigger than expected - 1,618 extension. Inside the impulse the waves are almost at the 1,618 extension too so I think the indexes are close to the low for wave 3. I was expecting 1x1 measurement and a low in January and I did not get it right how exactly the down move will develop. Now the waves 4 and 5 will provide the missing time for a low in January. Next week we should see wave 4 and after the holidays wave 5.


TECHNICAL PICTURE and ELLIOTT WAVES
Short term - from early December we have impulsive price action and this week feels like third wave. It counts well as impulse plus 1,618 Fibo measurement so I expect a low next week and wave 4. It is the most difficult wave to forecast almost impossible. If we see strong bounce from oversold levels target is 2500, or it could burn time with flat or triangle.


Intermediate term - RSI,histogram oversold as expected for third wave, bounce and divergence expected. Now the price is stretched way too far form MA200. For now I prefer A-B-C count instead of 1-2-3, but let's see what will happen in the next two months.


Long term - MA200 will be tested, the histogram with very deep trough comparable only to 2008. I do not think this is the way a big bear market begins - extreme readings for market breadth and indicators. I will be really surprised if we do not see an intermediate term low in January.


MARKET BREADTH INDICATORS
Market Breadth Indicators - extremely oversold again, levels seen at important lows like 2008,2011,2015. Time for bottoming and divergences needed a few weeks.
McClellan Oscillator - extremely oversold.
McClellan Summation Index - sell signal, extremely oversold.
Weekly Stochastic of the Summation Index - sell signal.
Bullish Percentage - extremely oversold.
Percent of Stocks above MA50 - extremely oversold.
Fear Indicator VIX - making a double top.
Advance-Decline Issues - extremely oversold.


HURST CYCLES
Day 19 for the second daily cycle.


Week 8 for the 20 week cycle.

Dec 15, 2018

Weekly preview

Final flush lower on Monday and "something" higher.... this something looks more clear now. Despite the ugly close for the week I think we have a flat running for b/Y and we should see another move higher to around 2700 - this will be your Christmas rally. After that the direction is lower with target below 2500. If I am wrong the price will just plunge lower to the expected target. This is too fast for me, time does not really fit, but the indicators on the daily chart(RSI,histogram) look dangerous.... we will know next week.


TECHNICAL PICTURE and ELLIOTT WAVES
Short term - I see corrective waves and I think it is wave b flat from the second leg lower. If I am wrong the indexes will just continue lower.


Intermediate term - I think the price will test one more time MA50 and the final sell off begins. Interesting is all three legs lower have the same size and I expect the same for the last one.
We have a transition from bullish to bearish mode(the same message from market breadth) - trending higher and bouncing up from MA200, transition phase breaking below it and testing it(failing to stay above it) next step is plunge lower and moving away from it.


Long term - intermediate term low expected in January below 2500 followed by multi month rally.


MARKET BREADTH INDICATORS
Market Breadth Indicators - turned lower most of them with sell signals - one more leg lower expected and divergences. This means the indexes switched from bullish to bearish mode. We had very oversold levels and instead of a rally we have a sideway move with market breadth staying at this oversold levels and divergence needed to see a more sustainable move up. This is behavior in bearish mode.
McClellan Oscillator - slightly oversold.
McClellan Summation Index - sell signal.
Weekly Stochastic of the Summation Index - sell signal.
Bullish Percentage - sell signal.
Percent of Stocks above MA50 - sell signal, close to oversold level.
Fear Indicator VIX - still elevated levels, but several lower highs, intermediate term low is expected in the next few weeks.
Advance-Decline Issues - turned lower and close to oversold levels.


HURST CYCLES
With one more low expected I have adjusted the cycle chart. I think we have one long 20 week cycle and currently a shorter one is running with a low expected in January for 18 month cycle low.

Day 28+4, with shorter cycle expected there is high probability that we have daily cycle low which fits with my expectations for a move lasting a little bit longer.


Week 7 for the 20 week cycle.


Tom Demark SEQUENTIAL AND COUNTDOWN - this technique spots areas of exhaustion.
We have the fourth sell off which fails to produce finished setup. My interpretation - the market is not trending lower, which means a lot of pain big sell offs, but it is a big correction and not a major top with impulsive reversal.

Dec 8, 2018

Weekly preview

Lower as expected, very fast and volatile move... and it looks like impulse to me. I can not see bottoming pattern and watching the charts my feeling tells me we should see something higher next week and final move lower to finish the decline which begun in September. So I still think the more likely outcome is up for wave 2/b and final sell off. Alternate options are triangle if we see MA50/MA200 tested on the daily chart or it is just bigger b/C, unlikely but let's say if I am wrong rally to around 2840 for much bigger flat.


TECHNICAL PICTURE and ELLIOTT WAVES
Short term - looking the indicators I do not think third wave or c lower running, more likely is to see something higher. If the second leg lower is already running the price should fail at MA50/MA200 on the hourly chart. If we see the price testing MA50/MA200 on the daily chart you can speculate that we have a triangle(e/B yellow) or just bigger b(red) wave. The last option much bigger flat(green labels) I think this scenario has very low probability.


Intermediate term - the same on the daily chart. The indicators suggest a-b-c higher, RSI turned lower from the upper trend line and it is testing the rising trend line, the histogram turned lower. As long as the price stays below MA50/MA200 the direction is lower. If I am wrong most likely we have a bigger flat with complex b wave(green).


Long term - no change, expecting one more low and move higher for a few months.


MARKET BREADTH INDICATORS
Market Breadth Indicators - some turned lower, there is no convincing buy/sell signals, expect divergences with the indexes making lower low for strong buy signal.
McClellan Oscillator - below zero.
McClellan Summation Index - buy signal.
Weekly Stochastic of the Summation Index - buy signal.
Bullish Percentage - turned lower.
Percent of Stocks above MA50 - turned lower, nearing oversold levels.
Fear Indicator VIX - still elevated levels, but several lower highs, intermediate term low is expected in the next few weeks.
Advance-Decline Issues - in the middle of the range.


HURST CYCLES
Day 27 possible mid cycle low.


Week 6... the picture is not 100% clear, adjustment will be needed after we see the indexes hit a bottom.

Dec 1, 2018

Weekly preview

We have strong move higher as expected.... but something bothers me. We have 3 up and 3 down, B wave for the SP500 retraced 90%, NDX 123% and now impulse is running.... this are textbook flat patterns. This could be 1/C, but it is very long or it cold be the whole wave C. Pullback for 2-3 days and rally to 2900 for wave 3/C does not fit much, I see some shares which need one more leg lower. The second option makes more sense to me. What I am saying it is very likely that we have a flat correction in November and another sell off to follow in December to test the January/April lows around 2550.
We have to watch very closely how the move lower develops after the current impulse is finished. I will definitely close my longs, I do not want to be caught riding a sell off.


TECHNICAL PICTURE and ELLIOTT WAVES
Short term - this final fifth wave made only half a point lower low and I thought we will see another 20-25 points lower on Monday to trap the last bears, but the indexes just gaped and continued higher. The move up is an impulse and still has a day or two to finish the fifth wave.
Red is the flat pattern and another sell off. We will watch the pullback if it is a zig-zag or impulse.


Intermediate term - the final wave of the impulse will hit resistance - MA50/MA200. The pattern looks more like retest of the broken MAs and such retests seldom have bullish outcome. RSI trapped between the two trend lines soon it will pick a direction and confirm what is going on.


Long term - one more sell off will test important support - the January/April lows and the middle trend line. We can only wait a week or two to see if my suspicion will be confirmed.


MARKET BREADTH INDICATORS
Market Breadth Indicators - turned up and look positive, most of them in the middle of their ranges.
McClellan Oscillator - above zero.
McClellan Summation Index - buy signal.
Weekly Stochastic of the Summation Index - buy signal.
Bullish Percentage - buy signal.
Percent of Stocks above MA50 - in the middle of the range.
Fear Indicator VIX - lower highs, but elevated levels.
Advance-Decline Issues - turned up in the middle of the range.


HURST CYCLES
Day 23 of the 40 day cycle. It does not look bullish - very deep retracement in the middle instead of steady move up for right translated cycle.


Week 5 of the 20 week cycle.