Sep 28, 2019

Weekly preview

The choppy price action continues, I can not see clear reversal pattern it looks corrective. For some indexes like NDX and RUT you can say ok it is impulse lower, but for NYSE/SP500/DJI it is a long shot, you can only assume we have reversal and wait for confirmation - lower high.

The EW pattern lower is not convincing, cycles expect a bounce from mid-daily cycle low, oscillators like the histogram or McClellan Oscillator resetting for two weeks so I expect one more high, but I will watch closely if we have just deep retracement and turn lower.


TECHNICAL PICTURE and ELLIOTT WAVES
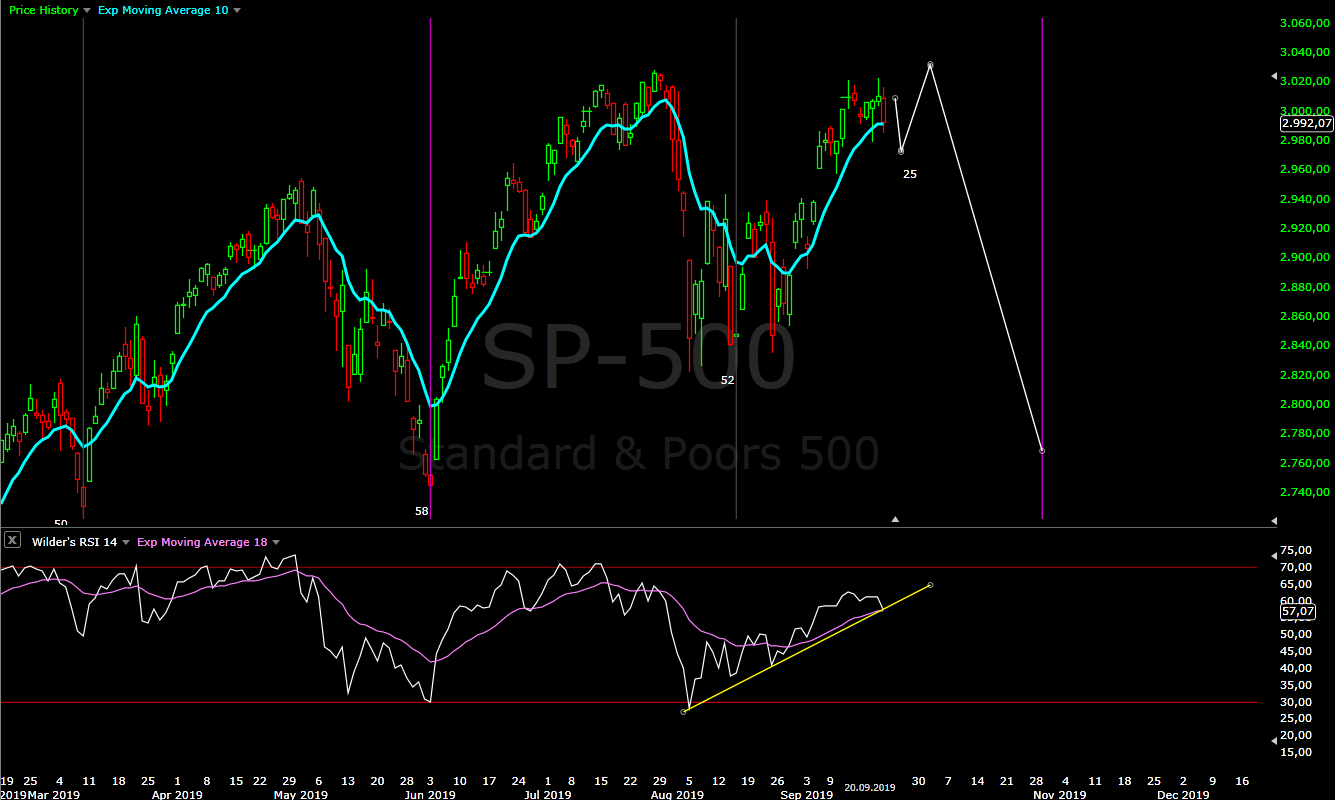
Short term - the corrective move lasts longer than expected and now the a-b-c from mid-August looks like 1-2-3 with missing fifth wave. I can not see convincing impulse lower, but lets say I am wrong than we have a-b-c higher and 1-2(red) now running.
RSI with downtrend, but overlapping and ready to break above the trend line - no signs for an impulse lower.


Intermediate term - with one more high for wave B you have to count double zig-zag w-x-y(red).
MACD with double divergence. RSI with double divergence and broke below the trend line, probably it will be tested with divergence. The histogram should make a lower high and divergence. The indicators are bearish and signal topping process is running. The price is at support and MA50 so we should see something higher.


Long term - one final leg lower into 2020 to complete the correction. The big question is if the decline will be a zig-zag or an impulse.
All the indicators look bearish like on the daily chart - topping and intermediate term high.


MARKET BREADTH INDICATORS
Market Breadth Indicators - with multiple divergences signaling important high around the corner. Now preparing for short term divergences and the end of this rally which begun in August.
McClellan Oscillator - resetting and below zero.
McClellan Summation Index - turned lower and sell signal, but I think we will see a divergence first.
Weekly Stochastic of the Summation Index - buy signal reached the overbought territory.
Bullish Percentage - double divergence and turned lower, I expect short term divergence as a sell signal.
Percent of Stocks above MA50 - double divergence and turned lower, I expect short term divergence as a sell signal.
Fear Indicator VIX - I expect higher low, when the market makes higher high.
Advance-Decline Issues - plunged lower to the zero area, I expect lower high and divergence.


HURST CYCLES
This move up is taking too long and if we see another 2-3 weeks higher the more likely count is 40 week cycle low in late August. This will mean 20 week cycle lasting 12 weeks and 40 week cycle lasting 35 weeks. I have seen such occasions when one 20 week cycle is too long and the other one is shorter so 35 weeks for the 40w cycle is perfectly fine the average anyway. We can only wait and see how long it will take the current move to make a high and how big the subsequent decline will be. For now I will stick to the current count.

Day 30 for the daily cycle. The most likely count is that we saw half daily cycle low(or 40 day cycle low) this week.


Week 17 for the 20 week cycle... it is taking too long.

Sep 21, 2019

Weekly preview

Small up and down moves this week, so nothing has changed. The indexes are close to important high and after this high it should be down for months until we see 4 year cycle high.

The big picture - EW possible patterns are if we do not see higher high A-B-C correction which begun in Jan.2018 or with higher high the move from Dec.2018 will look like a big ED and possible wave 5/III from 2009. The outcome will be the same(wave IV and 4 year cycle low 2020) so I do not really care which one it is, I am a trader theory is not important for me. I think one final higher high fits better, but we will see next week.
Cycles says the indexes should turn lower and with very high probability head lower for 4 year cycle low in 2020. Indicators with double divergences on the daily and weekly chart. Market breadth with double divergences too..... all signs point to important high and I can not see anything bullish.


TECHNICAL PICTURE and ELLIOTT WAVES
Short term - the same like last week. Lower high and we have w-x-y for b wave. Higher high and we have a-b-c probably the final zig-zag for a big ED from Dec.2018


Intermediate term - expect a high in September and lower in October. I think the indexes will squeeze higher high with possible ED for 5/III.
Multiple divergences on MACD and RSI.


Long term - one more decline into 2020 to finish the correction. B wave if we see lower high or 5/III if we see higher high with ED from Dec.2018.
Multiple divergences histogram and RSI.


MARKET BREADTH INDICATORS
Market Breadth Indicators - resetting higher and now with multiple divergences signaling important high around the corner.
McClellan Oscillator - resetting lower, probably one more push higher for divergences.
McClellan Summation Index - buy signal, double divergence.
Weekly Stochastic of the Summation Index - buy signal.
Bullish Percentage - buy signal, double divergence.
Percent of Stocks above MA50 - buy signal, double divergence.
Fear Indicator VIX - I expect one more leg down and reversal with multiple divergences.
Advance-Decline Issues - lower from overbought level, probably one more push higher with divergence.


HURST CYCLES
Day 25, it looks like half daily cycle with price testing MA10 and RSI testing the trend line and the MA.


Week 16 for the 20 week cycle, reversal lower should be imminent.

Sep 15, 2019

Weekly preview

The bulls do not give up, which does not change anything - another corrective rally and prolonged topping process.

The indexes are nearing the next high, but I think it will take another week or two before we see a significant decline. RUT is catching up and it looks like impulse higher is running. Watch when it is finished, most likely the indexes will turn lower at the same time.
The big picture - if we see higher high there is possible ED for c/B running.

As explained in previous posts for those who want to go short the time is in September. Personally I will enter short when I see the current short term pattern completed, then I will watch what happens - corrective move lower for possible 4/c/B or impulse and decline into intermediate term low late October/early November.


TECHNICAL PICTURE and ELLIOTT WAVES
Short term - another corrective move higher. The two possible patterns I see are w-x-y zig-zag(red) or you can count a-b-c lower for possible 2 of ED(NYSE/DJ made lower low) with a-b-c higher(white)... not the best impulse, but possible for wave c.


Intermediate term - I expect a high in September and lower in October. I think topping will begin next week and probably the indexes will squeeze higher high with possible ED for c/B.


Long term - one more decline into 2020 to finish the correction. The indexes are spending a lot of time topping so if wee see new highs and ED than a decline in five waves for C is more likely.... I hope so, I do not want to trade zig-zags.


MARKET BREADTH INDICATORS
Market Breadth Indicators - are resetting before the decline for the 40 week cycle in October.
McClellan Oscillator - still strong, no divergence.
McClellan Summation Index - buy signal.
Weekly Stochastic of the Summation Index - buy signal.
Bullish Percentage - buy signal.
Percent of Stocks above MA50 - buy signal.
Fear Indicator VIX - resetting lower, expect divergence.
Advance-Decline Issues - reached overbought levels.


HURST CYCLES
Day 20 for the daily cycle, still pointing up. Some are counting the low on 26th of August, but DAX,DJI,NYSE made a low on 15-th of August... I think this should be the low. It does not matter, I am watching my triggers MA10 and RSI for a signal when the current daily cycle will turn lower.


Week 15 for the 20 week cycle, the last 1/4 of the cycle is running and we a nearing it's high.