
Jan 31, 2014
Update
For now everything is running according to the plan. Pullback up has begun, the first leg of it is over now B wave of the correction is expected and than one more up to the1810-1815 area.
And this is the August 2007 comparison...

Jan 30, 2014
Update
The wave 4 finished exactly where it was expected but for CFD/Futures. DAX,DJ,SP500 made lower low and we have theoretically the last final wave 5 for this move. The internal structure of this wave 5 looks finished on CFD/Futures with nice five wave impulse lower on cash indexes is a little bit uglier probably ending diagonal, but it think this wave is finished. Lets say it this way I do not see nothing worth chasing to the downside anymore.
Finished 5 wave from the top, oversold for the short term, MACD divergence on the hourly chart in the making, McClellan Oscillator higher low... the odds are turning to the upside. I expect the next move to be to the 1810-1815 area.
My best guess the first wave lower has finished or it will be finished very soon(max 1760). Watch the market action - if it is not finished the index will open lower or make lower low short after the opening, if the wave is finished the price should try to move above 1784 the last minor high.
Jan 29, 2014
Update
FOMC, optimism, the futures are 10 points higher at 1800 so far so good:) we knew that. Where is the wave 4/only relief idea wrong? - from EW perspective C=1,618xA=32 points or target 1810-1812 (Fibo 50% at 1810), from TA perspective look at the post from Monday, the hourly chart, resistance is at 1810-1815.
Well you know now when the idea is wrong - above 1815.
Jan 28, 2014
Update
If the waves continue to work so nicely.... expect wave c of 4 to 1800-1805.
I have forgotten to mention tomorrow is FOMC. I do not expect wave 4 to top before the meeting. Could the FED surprise with something and abort the correction? I doubt it, but we will see tomorrow.


Jan 27, 2014
Update
A good spot for the end of wave 3.... support has been reached,first divergence on 15min chart and max extension for wave 3 reached(even overshoot it) wave 1=15 points, 3=4,236x1=64 points, subtract from wave 2 -> 1781.
Bounce for wave 4 - Fibo 38,2% is at 1800.


Jan 25, 2014
Visualy what to expect...
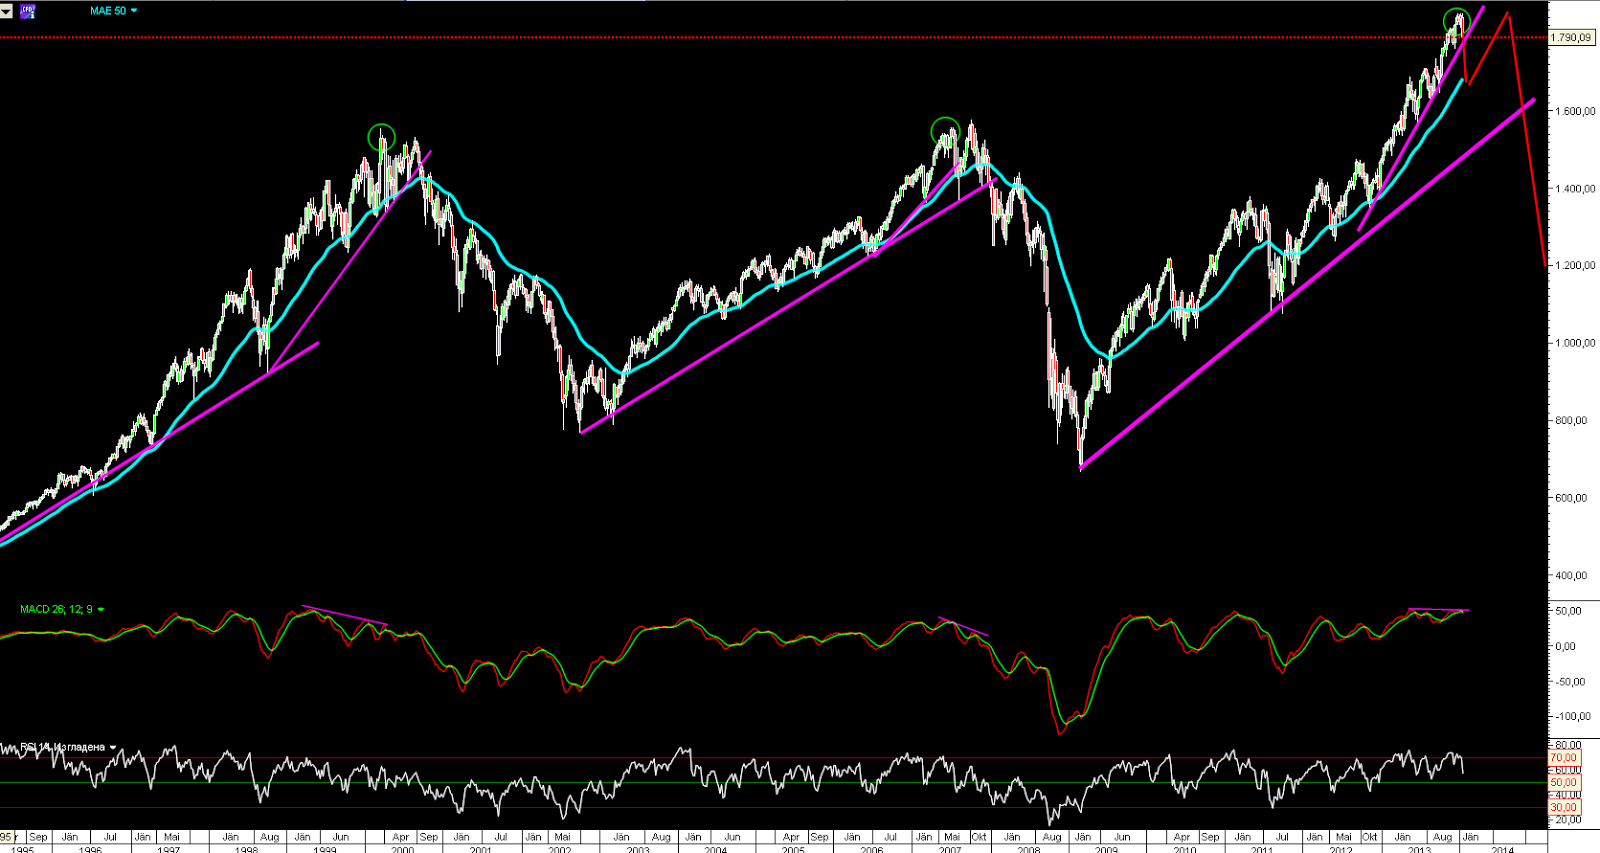
Here is visually what I expect... I think we will see something similar like in August 2007.
Why not just a pullback? - The price is way too far from MA50 - the rise is much steeper than 2000 and 2007, too much greed means to expect sharp correction (no correction for more than a year), 18 month cycle top - we always saw several weeks correction(see the previous post weekly cycle chart). Add to this ugly indicator divergences and extreme sentiment. That is why I do not expect only a pullback 1-2 week event.
Why only correction? - it could be only correction followed by another high or THE TOP. I do not care a lot which scenario because even in worst case (the bull market toped out)
the top will be tested. Bear markets usually does not start with a crash, a trend does not change this way MA50 will be tested and we will see a bounce, the next 18 month cycle
is coming and we should see at least 2-3 months to the upside, the central banks will come to the rescue.... etc.
So my best guess is sharp correction at least 3 weeks max 6 weeks - first target around 1650 support and MA50, second target 1550 support from the 2000 and 2007 tops and the lower trend line.
After that it does not look good for the bulls... I have posted this chart several months ago - a bull market accelerates before it ends. When the accelerated trend line is broken the long term trend starts reversing(topping) - MA50/trend line is tested, another rally follows with new high and divergence or lower high... the usual trend reversing process which you can see on every time frame. The difference is that this test of the high could last very long 3 months or 6 months....
 Lets say I am right, than look at the charts bellow - this is SP500 charts in 2007 daily and weekly. I think we will see something similar.
One day relief, another plunge support is at 1770 and 1750(more likely), 29-th FOMC FED comes to the rescue and retracement to the upside follows, final sell off to 1650. If you are bull you want to see the same pattern - 3 wave structure corrective, short living 19 trading days or 4 weeks in 2007.
Lets say I am right, than look at the charts bellow - this is SP500 charts in 2007 daily and weekly. I think we will see something similar.
One day relief, another plunge support is at 1770 and 1750(more likely), 29-th FOMC FED comes to the rescue and retracement to the upside follows, final sell off to 1650. If you are bull you want to see the same pattern - 3 wave structure corrective, short living 19 trading days or 4 weeks in 2007.
 Correction for 4-5 weeks MA50 and the trend line were tested to the downside, followed by a rally to the highs with divergence.


Weekly review
Short term view - short relief another lower low before more significant pullback.
Intermediate term view - intermediate term correction for 4-6 weeks.
I was expecting an intermediate term correction for a long time. The move stretched in time, but if you look at SP500 weekly chart for the last 9 weeks SP500 has not advanced a lot, it was at 1800 in mid November. The bulls freaked out and guys like me suggesting a correction is coming looked like idiots for two months:) Now with one day two months are wiped out...
I have not nailed the top, but that is not so important. I have posted a warning on 17-th January to be careful not to be caught on the upside, that the DAX topped out and probably the top for the most of the indexes is behind us, on Thursday to expect something lower to 1830 or 1820 and on Friday to short bellow 1820. So if you read carefully you should not hold the bag now and even made some money.
I do not think that the move lower is over. As I wrote huge bars appear at the end of a move exhaustion or at the beginning igniting buying/selling. I think the move has just started. Based on cycles it should last 4-6 weeks. Based on sentiment(too much greed) and the furious way it has begun I will bet on sharp sell off which usually purge the greed and punish the herd. Such sell offs are short living because they are moving too fast - fear is stronger emotion than greed.
Short term - you do not see a low when there is maximum fear(and yesterday feels like that) so I think we will see soon relief move up because of seller exhaustion and another lower low.
Intermediate term sharp correction for several weeks - second half of February early March.
TECHNICAL PICTURE
Short term - the low where you see a lot of fear is usually not the bottom... expect a relief move up and another lower low. In EW terms we are in wave 3 expect waves 4 and 5. I do not know if 3 is over and it is not important(if you shorted at 1820 as I wrote) the next tradable move is to short wave 4.
 - Triple cross(EMA10 and EMA20 crossing EMA50) - the short term trend is down.
Intermediate term - Intermediate term correction has begun. Close bellow MA50 and the middle trend line.. very bad for the bulls. I think we will see a move to the lower trend line 1625-1650. The market breadth indicators and the divergence on many indicators support such development.
 - Trend direction EMA50/MACD - the intermediate term trend is down, the MACD divergence is playing out.
- Momentum Histogram/RSI - momentum is down, short term trend is down.
Long term - the topping process was aborted, final blow off move and now is time for a correction.... too much greed for too long.
 - Trend direction EMA50/MACD - long term trend is up - the price above MA50 and MACD above zero. There is scenario that this is the top for the bull market, do not worry there will be a second chance to get out of longs/load on shorts.
- Momentum Histogram/RSI - momentum is down, intermediate term trend is down.
MARKET BREADTH INDICATORS
The Market Breadth Indicators - were flashing red flags for the intermediate term for a long time now we see the price breaking lower and confirming the weekness. For the short term VIX and the McClellan Oscillator overshoot their BB and relief move in the opposite direction is expected soon.
McClellan Oscillator - we had divergence for a long time you should not be surprised. Now it is way bellow its BB so expect something in the opposite direction in the next day or two.
McClellan Summation Index - turned lower, no sell signal but it a matter of time.
Weekly Stochastic of the Summation Index - in overbought territory soon a sell signal will follow. Plenty of room to move lower.
Bullish Percentage - the strongest drop since May 2013. This time we will see a correction....
Percent of Stocks above MA50 - huge plunge, there is still room to the downside. We should see the indicator moving bellow 25 before this move is over.
Fear Indicator VIX - huge spike up... it needs time to calm down.
Advance-Decline Issues - multiple divergences, so you should not be surprised from the move or if we see a correction after more than a year only up and up...
Put/Call ratio - coming down from the moon:)
HURST CYCLES
The short term cycles behave as expected... the last move up was shorter and smaller compared to the other ones, the current 20 day cycle broke bellow the low for the previous one... all this are signs that the cycles of bigger degree have topped out and the indexes should move lower for a while. Looking at the previous 40 day cycles 47/46/46 another 17 trading days or 3-4 weeks lower will fit perfect.

I was expecting the top of the current 20 week and the 18 month cycle for a while. The cycle have been stretched, but now everything falls into place.
Now let's look at the cycles - this should be a 18 month cycle low so the move lower should last several weeks at least. What happened the previous three times(18 month lows) - every time you have a topping for several weeks or longer and real sell off so to speak. The corrections from the top lasted 10/23/9 weeks and the sell off for 5/4/6 weeks. We have our topping, SP500 has not advance at all for the last 4 weeks and the sell of has begun so I expect another 3-5 weeks correction.
From another angle - the average size of the 20 week cycle is 14 to 16 weeks and we have several extended cycles 20/20/23. I do not think the correction is over so another extended cycles means another 4 to 7 weeks. Too much greed is purged with sharp correction. I think 7 weeks are too much so I will bet on something like 4-5 weeks.
Tom Demark SEQUENTIAL AND COUNTDOWN - this technique spots areas of exhaustion.
Well this time the combo nailed the top..... no comment needed:)

Intermediate term view - intermediate term correction for 4-6 weeks.
I was expecting an intermediate term correction for a long time. The move stretched in time, but if you look at SP500 weekly chart for the last 9 weeks SP500 has not advanced a lot, it was at 1800 in mid November. The bulls freaked out and guys like me suggesting a correction is coming looked like idiots for two months:) Now with one day two months are wiped out...
I have not nailed the top, but that is not so important. I have posted a warning on 17-th January to be careful not to be caught on the upside, that the DAX topped out and probably the top for the most of the indexes is behind us, on Thursday to expect something lower to 1830 or 1820 and on Friday to short bellow 1820. So if you read carefully you should not hold the bag now and even made some money.
I do not think that the move lower is over. As I wrote huge bars appear at the end of a move exhaustion or at the beginning igniting buying/selling. I think the move has just started. Based on cycles it should last 4-6 weeks. Based on sentiment(too much greed) and the furious way it has begun I will bet on sharp sell off which usually purge the greed and punish the herd. Such sell offs are short living because they are moving too fast - fear is stronger emotion than greed.
Short term - you do not see a low when there is maximum fear(and yesterday feels like that) so I think we will see soon relief move up because of seller exhaustion and another lower low.
Intermediate term sharp correction for several weeks - second half of February early March.
TECHNICAL PICTURE
Short term - the low where you see a lot of fear is usually not the bottom... expect a relief move up and another lower low. In EW terms we are in wave 3 expect waves 4 and 5. I do not know if 3 is over and it is not important(if you shorted at 1820 as I wrote) the next tradable move is to short wave 4.

Intermediate term - Intermediate term correction has begun. Close bellow MA50 and the middle trend line.. very bad for the bulls. I think we will see a move to the lower trend line 1625-1650. The market breadth indicators and the divergence on many indicators support such development.

- Momentum Histogram/RSI - momentum is down, short term trend is down.
Long term - the topping process was aborted, final blow off move and now is time for a correction.... too much greed for too long.

- Momentum Histogram/RSI - momentum is down, intermediate term trend is down.
MARKET BREADTH INDICATORS
The Market Breadth Indicators - were flashing red flags for the intermediate term for a long time now we see the price breaking lower and confirming the weekness. For the short term VIX and the McClellan Oscillator overshoot their BB and relief move in the opposite direction is expected soon.
McClellan Oscillator - we had divergence for a long time you should not be surprised. Now it is way bellow its BB so expect something in the opposite direction in the next day or two.
McClellan Summation Index - turned lower, no sell signal but it a matter of time.
Weekly Stochastic of the Summation Index - in overbought territory soon a sell signal will follow. Plenty of room to move lower.
Bullish Percentage - the strongest drop since May 2013. This time we will see a correction....
Percent of Stocks above MA50 - huge plunge, there is still room to the downside. We should see the indicator moving bellow 25 before this move is over.
Fear Indicator VIX - huge spike up... it needs time to calm down.
Advance-Decline Issues - multiple divergences, so you should not be surprised from the move or if we see a correction after more than a year only up and up...
Put/Call ratio - coming down from the moon:)
HURST CYCLES
The short term cycles behave as expected... the last move up was shorter and smaller compared to the other ones, the current 20 day cycle broke bellow the low for the previous one... all this are signs that the cycles of bigger degree have topped out and the indexes should move lower for a while. Looking at the previous 40 day cycles 47/46/46 another 17 trading days or 3-4 weeks lower will fit perfect.

I was expecting the top of the current 20 week and the 18 month cycle for a while. The cycle have been stretched, but now everything falls into place.
Now let's look at the cycles - this should be a 18 month cycle low so the move lower should last several weeks at least. What happened the previous three times(18 month lows) - every time you have a topping for several weeks or longer and real sell off so to speak. The corrections from the top lasted 10/23/9 weeks and the sell off for 5/4/6 weeks. We have our topping, SP500 has not advance at all for the last 4 weeks and the sell of has begun so I expect another 3-5 weeks correction.
From another angle - the average size of the 20 week cycle is 14 to 16 weeks and we have several extended cycles 20/20/23. I do not think the correction is over so another extended cycles means another 4 to 7 weeks. Too much greed is purged with sharp correction. I think 7 weeks are too much so I will bet on something like 4-5 weeks.

Tom Demark SEQUENTIAL AND COUNTDOWN - this technique spots areas of exhaustion.
Well this time the combo nailed the top..... no comment needed:)

Jan 24, 2014
Update
We saw "huge bar" yesterday... There is two options with huge bars - exhaustion, final blow off so to speak and the second new move up/down has just begun. Looking at this chart it looks to me like exhaustion bar. We have a move with three waves(corrective), which corrected to MA50 on the daily chart - one down(finished with such bar too) two up and three down. I will bet on exhaustion bar and finished pull back.
SP500 found support yesterday at the second target 1820. Long trade with stop bellow 1820 is not a bad idea.
If I am wrong a move lower has just begun... you should see the SP500 moving lower, without loosing too much time(than sell it with stop above the high for the bounce before the close), moving and closing bellow MA50 on the daily chart.
Jan 23, 2014
Update
The futures are sharply lower and if they do not recover I will watch this complex choppy W-X-Y. C=A from Y around 1828-1830 which is 61,8% Fibo too. Last chance for the bulls and the green scenario is 1820 where C=1,618xA.


Jan 22, 2014
Update
So far the main idea(green scenario) is working - a little bit lower and than higher.... at least trying for now. If the scenario continue to work as expected the price should stay above 1840(MA50 hourly chart) and tomorrow and Friday should be green days making new highs. Measuring the pattern from the neckline points to around 1885.


Jan 19, 2014
Weekly review
Short term view - not clear, but I am still leaning to the upside until proven otherwise.
Intermediate term view - still up, but again the next intermediate term move will be to the downside.
Last week we saw choppy move and I did not know where the low is, but as I wrote it should be bought. That was the right idea. The week was flat, SP500 closed the gap and closed at 1838... more confusion:)
Ok looking at the the charts,indicators,EW,cycle for the short term I do not see an edge to say the market will go higher or lower. I would wait to see what the market wants to do.
I am still leaning to the upside - on the daily chart it looks like the indicators are reseting, but the price do not want to move lower, which makes me think that the final rally is missing(or it has started this week). If the market wants to move higher it is allowed to move a little bit lower but than we should see sharp rally next week.
If something to the downside has started the bears should show strength - the market should follow the indicators and move fast lower to the first support - 1810.
TECHNICAL PICTURE
Short term - for now the price action to the downside this week is similar to the A-B-C but on smaller scale. The indicators are reseting like on the daily chart... so we should stay with the green scenario, but be cautious. If we see sharp decline(red scenario) it will mean the indicators hourly and daily are not just resetting, but the divergences have kicked in.
 - Triple cross(EMA10 and EMA20 crossing EMA50) - the short term trend is not clear.....
Intermediate term - no change final rally to the purple trend line expected.... than sharp correction.
 - Trend direction EMA50/MACD - the intermediate term trend is up, but we are seeing now double MACD divergence. Watch out for a trend reversal.
- Momentum Histogram/RSI - momentum is weak, short term trend is not clear.
Long term - flat week no change waiting for the end of the blow off phase.
 - Trend direction EMA50/MACD - long term trend is up - the price above MA50 and MACD above zero. Watch out for the MACD divergence - something bad could happen.
- Momentum Histogram/RSI - the histogram printed another lower bar... momentum is reversing?
MARKET BREADTH INDICATORS
The Market Breadth Indicators - intermediate/long term red flags....
McClellan Oscillator - positive, but we are seeing divergence...
McClellan Summation Index - buy signal and it is rising...
Weekly Stochastic of the Summation Index - buy signal, it has reached the overbought area.
Bullish Percentage - another lower high, but at bullish levels.
Percent of Stocks above MA50 - weaker than expected, probably we will see another lower high.
Fear Indicator VIX - again a lot of complacency, at levels where we saw bottoms the whole year 2013, which means top for the stocks.
Advance-Decline Issues - weakness... I expect another lower high.
Put/Call ratio - the traders are very very very excited....
HURST CYCLES
I think we are in the middle of the current 40 day cycle. We saw the first 20 day cycle bottoming on Monday and the next one higher has begun.

Nothing new the move is already very stretched in time matching the initial rally in 2009 and the size is the same like the previous two 18 month cycle tops. That makes me think the move into the 18 month cycle low will be very sharp and compressed in time - not more than 4-6 weeks but the usual 10%-15%.

Tom Demark SEQUENTIAL AND COUNTDOWN - this technique spots areas of exhaustion.
Nothing interesting on the daily chart.... and it is matter of interpretation if this was week 13 or not. DJ did not make new high and Sp500 only 1 point. But we are geting close to another overbought level.

Intermediate term view - still up, but again the next intermediate term move will be to the downside.
Last week we saw choppy move and I did not know where the low is, but as I wrote it should be bought. That was the right idea. The week was flat, SP500 closed the gap and closed at 1838... more confusion:)
Ok looking at the the charts,indicators,EW,cycle for the short term I do not see an edge to say the market will go higher or lower. I would wait to see what the market wants to do.
I am still leaning to the upside - on the daily chart it looks like the indicators are reseting, but the price do not want to move lower, which makes me think that the final rally is missing(or it has started this week). If the market wants to move higher it is allowed to move a little bit lower but than we should see sharp rally next week.
If something to the downside has started the bears should show strength - the market should follow the indicators and move fast lower to the first support - 1810.
TECHNICAL PICTURE
Short term - for now the price action to the downside this week is similar to the A-B-C but on smaller scale. The indicators are reseting like on the daily chart... so we should stay with the green scenario, but be cautious. If we see sharp decline(red scenario) it will mean the indicators hourly and daily are not just resetting, but the divergences have kicked in.

Intermediate term - no change final rally to the purple trend line expected.... than sharp correction.

- Momentum Histogram/RSI - momentum is weak, short term trend is not clear.
Long term - flat week no change waiting for the end of the blow off phase.

- Momentum Histogram/RSI - the histogram printed another lower bar... momentum is reversing?
MARKET BREADTH INDICATORS
The Market Breadth Indicators - intermediate/long term red flags....
McClellan Oscillator - positive, but we are seeing divergence...
McClellan Summation Index - buy signal and it is rising...
Weekly Stochastic of the Summation Index - buy signal, it has reached the overbought area.
Bullish Percentage - another lower high, but at bullish levels.
Percent of Stocks above MA50 - weaker than expected, probably we will see another lower high.
Fear Indicator VIX - again a lot of complacency, at levels where we saw bottoms the whole year 2013, which means top for the stocks.
Advance-Decline Issues - weakness... I expect another lower high.
Put/Call ratio - the traders are very very very excited....
HURST CYCLES
I think we are in the middle of the current 40 day cycle. We saw the first 20 day cycle bottoming on Monday and the next one higher has begun.

Nothing new the move is already very stretched in time matching the initial rally in 2009 and the size is the same like the previous two 18 month cycle tops. That makes me think the move into the 18 month cycle low will be very sharp and compressed in time - not more than 4-6 weeks but the usual 10%-15%.

Tom Demark SEQUENTIAL AND COUNTDOWN - this technique spots areas of exhaustion.
Nothing interesting on the daily chart.... and it is matter of interpretation if this was week 13 or not. DJ did not make new high and Sp500 only 1 point. But we are geting close to another overbought level.

Jan 17, 2014
Warning
The DAX finished 5 waves up a new ATH and reversed today SP500, Russell2000, XLF, Nasdaq, DJ Transportation they all made new highs some of them ATH only DJ not.... be careful not to be surprised to the downside. It is possible that the indexes has topped out. If the SP500 closes bellow 1838 the possibility will be very high the we saw the top two days ago.
Jan 15, 2014
Update
Ok the idea was right... I am not really surprised:) The question now is how high. Most of the indexes made a new high only DJ not. I suspect it will make it too, but I do not guarantee it any more:) If you a are bear you want to see this ATH you want to see even more excitement from the bulls they should be 110% invested.
The DAX continue accelerating. The last two moves up since mid December are already perpendicular on all charts – hourly, daily and weekly... if this is not a final blow off I do not know how it should look like..... so it is time to be cautious, but do not tell the bulls:).


Jan 14, 2014
Update
This is what i meant with the pullback could not be over... now w=y and we should see a reversal higher if the idea is right. If it is wrong the correction has begun and we are in a wave 3 which means the price just continue moving lower. It is make or break we will know very soon in the next day or two.


Jan 12, 2014
Weekly review
Short term view - the pullback could not be finished, but I think we will see one more push higher...
Intermediate term view - soon after that I expect an intermediate term top(or the TOP) and strong move lower...
Boring two weeks, very choppy move... probably corrective with a lot of fake outs. Even if the pullback is not over, the low is/will be a short term buy for one last push higher.
Short term - the move is a mess and I thinks it is corrective. I have posted DJ hourly chart instead of SP500. It looks more clear. I think we are seeing an impulse with one last wave missing. Wave three is extended so wave 5 should be small and if it has the same size like wave 1 we should see at best marginal new high, a few points about the last high.For the SP500 this should be something between 1850-1860 - my old target before the holidays.
Intermediate term - no change, I expect very sharp correction or top for the bull market. The topping pattern was aborted(see the weekly chart) which means we should expect blow off top. John Hampson wrote more about that if you want to read. We will just follow the market and let it tell us what it wants to do....
TECHNICAL PICTURE
Short term - the chart says it all. One final wave is missing. It should be weak and short living... we should see another MACD divergence and sharp reversal.
 - Triple cross(EMA10 and EMA20 crossing EMA50) - the short term trend is not clear.....
Intermediate term - sp500 is moving according to the plan. Now waiting to see if the reversal from the trend line will occur. Multiple MACD and histogram divergences say yes we will see it.
 - Trend direction EMA50/MACD - the intermediate term trend is up, but we are seeing now double MACD divergence. Watch out for a trend reversal.
- Momentum Histogram/RSI - momentum is weak, short term trend is not clear.
Long term - I wrote in November and December that if the markets does not reverse we will see blow off top and not a topping process.... well I think now it is official. The problem is the divergences are still here and the bullish sentiment is through the roof...
John Hampson - it is the second largest and third longest equities bull of the last 80 years, where margin debt and investor credit spiked to dot.com peak levels (highest ever), where Market Cap to GDP valuation reached the second highest ever (first: the dot.com peak), where we printed some all-time record sentiment readings, including the highest ever II bull/bear spread, and stocks rose into their peak in a compressing parabolic, chasing price without earnings for 2 years into the peak. - Trend direction EMA50/MACD - long term trend is up - the price above MA50 and MACD above zero. Watch out for the MACD divergence - something bad could happen.
- Momentum Histogram/RSI - the histogram made lower bar... momentum is reversing?
MARKET BREADTH INDICATORS
The Market Breadth Indicators - positive for the short term and more divergences long term....
McClellan Oscillator - positive the wave up is not finished probably we will see a divergence when the move is over.
McClellan Summation Index - buy signal, it is rising but I expect another lower high
Weekly Stochastic of the Summation Index - buy signal, it has reached the overbought area.
Bullish Percentage - probably we will see another lower high.
Percent of Stocks above MA50 - weaker than expected, probably we will see another lower high.
Fear Indicator VIX - again a lot of complacency, at levels where we see a bottom whole year which means top for the stocks.
Advance-Decline Issues - weakness... I expect another lower high.
Put/Call ratio - the traders are very very very excited.... like before the top in 2011.
HURST CYCLES
Almost reached the half of the time for a 40 day cycle... reversal around the corner?

The move is already very stretched in time matching the initial rally in 2009 and the size is the same like the previous two 18 month cycle tops. In the last 7 weeks sp500 has not moved significantly higher.... I think it is time to see the top for this 18 month cycle.

Tom Demark SEQUENTIAL AND COUNTDOWN - this technique spots areas of exhaustion.
Finished 9-13-9 sequence - reversal around the corner? The weekly chart is near to a sell signal too... both time frames flashing sell in sync...
 One final higher high will finish the combo and that fits perfect with EW and technical analysis... interesting.

Intermediate term view - soon after that I expect an intermediate term top(or the TOP) and strong move lower...
Boring two weeks, very choppy move... probably corrective with a lot of fake outs. Even if the pullback is not over, the low is/will be a short term buy for one last push higher.
Short term - the move is a mess and I thinks it is corrective. I have posted DJ hourly chart instead of SP500. It looks more clear. I think we are seeing an impulse with one last wave missing. Wave three is extended so wave 5 should be small and if it has the same size like wave 1 we should see at best marginal new high, a few points about the last high.For the SP500 this should be something between 1850-1860 - my old target before the holidays.
Intermediate term - no change, I expect very sharp correction or top for the bull market. The topping pattern was aborted(see the weekly chart) which means we should expect blow off top. John Hampson wrote more about that if you want to read. We will just follow the market and let it tell us what it wants to do....
TECHNICAL PICTURE
Short term - the chart says it all. One final wave is missing. It should be weak and short living... we should see another MACD divergence and sharp reversal.

Intermediate term - sp500 is moving according to the plan. Now waiting to see if the reversal from the trend line will occur. Multiple MACD and histogram divergences say yes we will see it.

- Momentum Histogram/RSI - momentum is weak, short term trend is not clear.
Long term - I wrote in November and December that if the markets does not reverse we will see blow off top and not a topping process.... well I think now it is official. The problem is the divergences are still here and the bullish sentiment is through the roof...
John Hampson - it is the second largest and third longest equities bull of the last 80 years, where margin debt and investor credit spiked to dot.com peak levels (highest ever), where Market Cap to GDP valuation reached the second highest ever (first: the dot.com peak), where we printed some all-time record sentiment readings, including the highest ever II bull/bear spread, and stocks rose into their peak in a compressing parabolic, chasing price without earnings for 2 years into the peak.

- Momentum Histogram/RSI - the histogram made lower bar... momentum is reversing?
MARKET BREADTH INDICATORS
The Market Breadth Indicators - positive for the short term and more divergences long term....
McClellan Oscillator - positive the wave up is not finished probably we will see a divergence when the move is over.
McClellan Summation Index - buy signal, it is rising but I expect another lower high
Weekly Stochastic of the Summation Index - buy signal, it has reached the overbought area.
Bullish Percentage - probably we will see another lower high.
Percent of Stocks above MA50 - weaker than expected, probably we will see another lower high.
Fear Indicator VIX - again a lot of complacency, at levels where we see a bottom whole year which means top for the stocks.
Advance-Decline Issues - weakness... I expect another lower high.
Put/Call ratio - the traders are very very very excited.... like before the top in 2011.
HURST CYCLES
Almost reached the half of the time for a 40 day cycle... reversal around the corner?

The move is already very stretched in time matching the initial rally in 2009 and the size is the same like the previous two 18 month cycle tops. In the last 7 weeks sp500 has not moved significantly higher.... I think it is time to see the top for this 18 month cycle.

Tom Demark SEQUENTIAL AND COUNTDOWN - this technique spots areas of exhaustion.
Finished 9-13-9 sequence - reversal around the corner? The weekly chart is near to a sell signal too... both time frames flashing sell in sync...


Jan 8, 2014
Update
Short term I am not sure what to expect... my feeling tells me one more wave higher is missing. Inverted H&S measures 20 points with target 1860 which is the second target I mentioned several weeks ago.
The short signal which I have posted is still at a profit, but I would not expect much. Put it on break even around 1840. Move above 1840 will trigger long signal.


Jan 2, 2014
Update
It looks like one of the markets has reversed - the precious metals (GOLD/SILVER). The indexes are nice short with risk around 10 points and good reward. SP500 bellow 1838 will trigger short term down signal.
Subscribe to:
Posts (Atom)