Trading trigger - buy signal, now heading into intermediate term high.
Analysis - long term sell the rips, I think we have major top which will be tested one more time. Intermediate term - nearing a high.
P.S. - for a trade both analysis and trigger should point in the same direction.

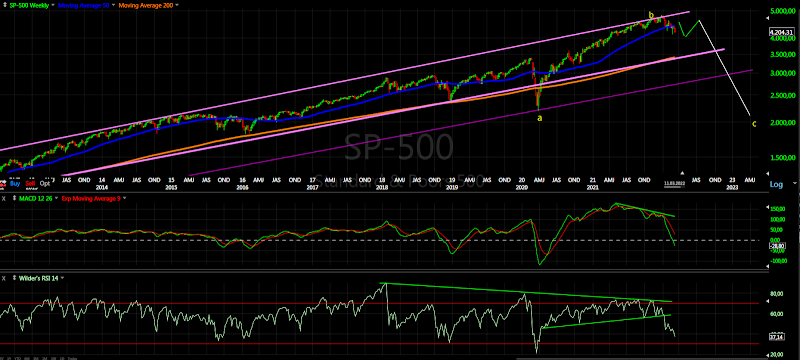
TECHNICAL PICTURE and ELLIOTT WAVES
Short term - two options the important low was in January with 20w low on time and since then 2/b-wave running which is nearing the 20w high. The other option is the low was in March and this is the first leg of a zig-zag higher.

Intermediate term - I see W-x-Y(yellow) with complex double zig-zag for Y=W, alternate we have Z-wave(red). Look at RSI - it often shows the pattern more clear and it looks like a-b-c for 2/b-wave so far.

Long term - topping process running for months and maturing. Some kind of corrective wave b-wave and c-wave will follow.

MARKET BREADTH INDICATORS
Market Breadth Indicators - pointing up, but only a few touched overbought level, so there is no confirmation for a strength... so far confirming b-wave.
McClellan Oscillator - small divergence after hitting overbought level.
McClellan Summation Index - buy signal.
Weekly Stochastic of the Summation Index - buy signal.
Bullish Percentage - touched overbought level.
Percent of Stocks above MA50 - in the middle of the range.
Fear Indicator VIX - reseting lower.
Advance-Decline Issues - moving higher, but has not reached overbought level to confirm strength..
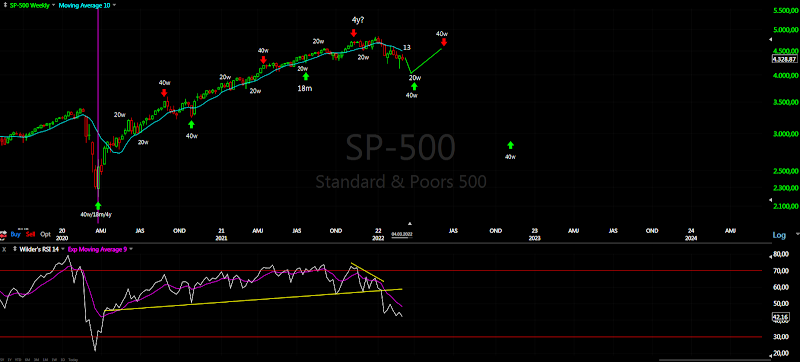
HURST CYCLES
Short term cycles - the strength means either we saw important cycle low or completing important cycle high - I think it is the later.
Second 5w cycle higher running to complete at least 10w high more likely 20w high.

Week 8 for the 20w cycle if we use the model on the chart above. There is room for interpretation at the moment.
Long term we have 4 year cycle high and transition from up to down. The 18m low either late September with one extra 20w cycle or alternate on time in June/July... waiting to see how the pattern will play out to confirm one of the two options. In both cases I expect highs echo from 2018.