Jul 30, 2010

Short term update

It looks like that the bulls are winning the battle.
DJ broke intraday the support level just to touch the lower trend line of the wedge. Next move is UP to resistance zone and upper trend line of the wedge 10700-10750.

Jul 29, 2010

Short term update

On schedule:)
Lets see if DJ will hold support and make the last wave UP.

Jul 20, 2010

Short term update

This market is very difficult:) bellow is the update - bullish and bearish short term scenario.

I have told that I am not convinced that this is a 3 of 3 wave. It does not behave like third wave. Today we have hit 50% retracement and reversed hard upward after MACD divergence on the 15-min chart and the Histogram on the 60-min chart.
Now the alternate scenario, which I have shown last week, is equally probable.
Expect higher low to reset the oscillators and carve out H&Sh pattern on the 15-min chart followed by a surge.


The bears should prove them selfs and bring this market lower. If this is really 3 of 3 we should see hard sell off and never look back. But this does not happens...

Jul 18, 2010

Weekly review / Седмичен преглед

Hello traders!!!!!
Last week forecast was for a UP to resistance ~10330 followed by a pullback to support levels 10190 or 10090.
And exactly that happen - DJ overshooted the 10330 level and found resistance at the MA200 and the trend line. After that we saw a sell off to 10090 - minor support level and 38,2 retracement of the previous move.
It is difficult to forecast this market but it has played out pretty good this last week:)

So what now? ... I do not know, so simple, is not it:)))
My primary view was, that we will see higher prices after a pullback. But this very long candle with high volume does not look like a pullback rather like the beginning of a new down move.
- Histogram has turned slope downward - mMm pattern
- Long red candle with high volume ignites selling
- Prices finding resistance at the trend line, MA200
That is bearish and we should follow the market until it say us something different. So my primary view is now bearish. Look at the first two charts. Short term we can see some relief at the start of the week before going lower see (the 15-min chart), or just continue lower and never look back if this is really third of a third wave. Next week we should close lower or this scenario is dead and the alternate scenario below will become primary.


Alternate Scenario
The third and forth chart present the alternate scenario. The problem is that everybody are focused on the H&S pattern, the blogs a full of bearish counts and the market does not do what everybody expect. So this scenario is bearish too and I expect a correction and very week autumn, but before that the market will fool both bulls and bears and make them scratching their heads asking them selfs what is going on.
Keep an eye on this charts. Next week we should not close lower if this is the real story.


Bullish scenario if we go lower for several weeks but the market make higher low and break the trend line. Than we will have bullish falling wedge followed by a new UP leg making new highs for the year.

Jul 15, 2010

Short term update

Pullback has began as expected.
On the chart is what I expect to happen in the next 1-2 weeks. Support levels 10190 and 10090.
Look at the chart from the weekly review for the bearish scenario. It can not be ruled out.

Jul 13, 2010

Short term update

DJ has corrected sideways, the histogram has reseted and now we see the next move up to the resistance zone ~10330 (well we overshooted it a little bit:).
It has played out a little bit different, but still the same story. Lets see if DJ will start a pullback at this levels.

Jul 11, 2010

Short term forecast / Краткосрочна прогноза

Hello,
short term I expect DJ to hit ~10320. At this level is the resistance and the upper line of the falling trend channel(see the daily charts from the weekly review). We can just go higher and hit the level, or have a short pullback and then rally to resistance.
I think we will see 1 or 2 sideway days, because we have MACD divergence on the 15-min chart and on the 1h chart the histogram has downward slope. You can see on the charts how it can look like with the support and resistance levels.
Lets see what will happen Monday and Tuesday. Be patient now its too late to chase it the risk is too high.


Weekly review / Седмичен преглед

Hello traders!!!
the market makes everything possible to drive crazy both camps - bulls and bears and makes it very good.
What should we do in such conditions when the market is very volatile and moves up and down like crazy with no direction?
- Long term trading... forget it a while, step back and look at the big picture. Wait till the market finds its direction. Both camps have valid arguments, but you should be clever wait for the market to tell you the story and then join to the winning camp.
- Short term trading - the market has no clear direction, but this does not mean that we can not trade the swings and make money. So lets concentrate on the short term charts and make some profits:)

On the weekly chart we have a bullish engulfing candle and the histogram made a higher bar. On the daily chart we have a divergence on the MACD and the histogram is rising(now its over the zero line). This tells me that the indexes will move higher for a while 2-3 weeks. The market gives us bullish signals and we should listen what the market has to say and stay bullish at least for the short term.

The bullish scenario is we are in a trading range for the summer and the months of September/October and then we will see new highs at the year end. I am not convinced, but so what if it plays out this way. I have no problem with that.

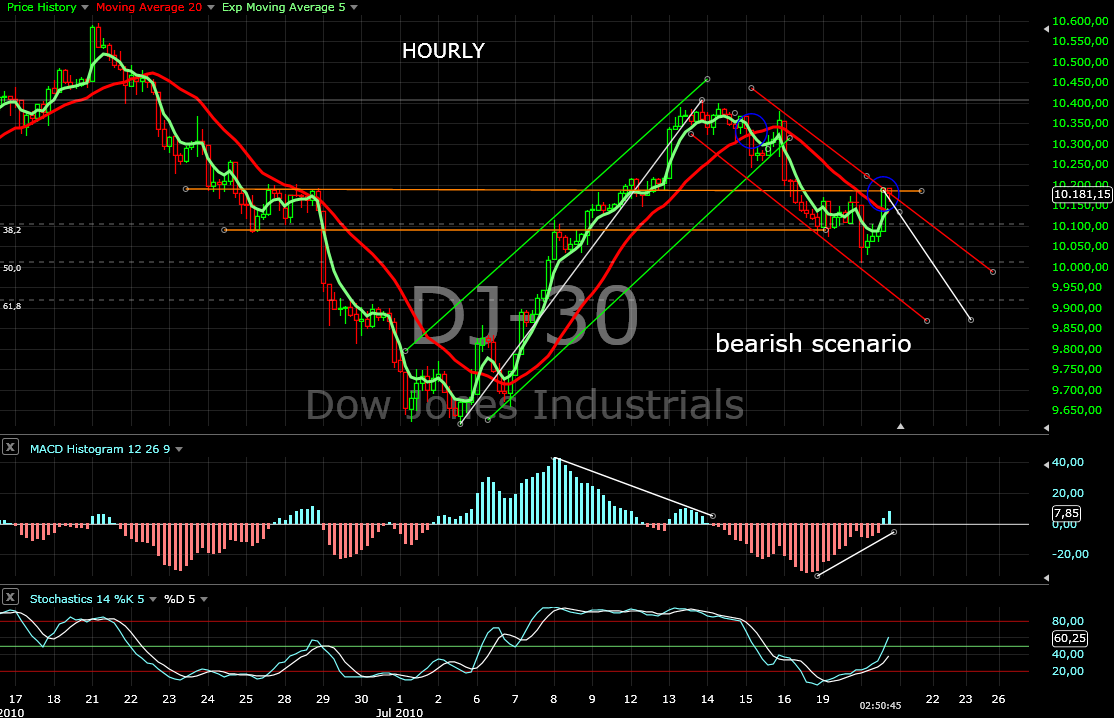
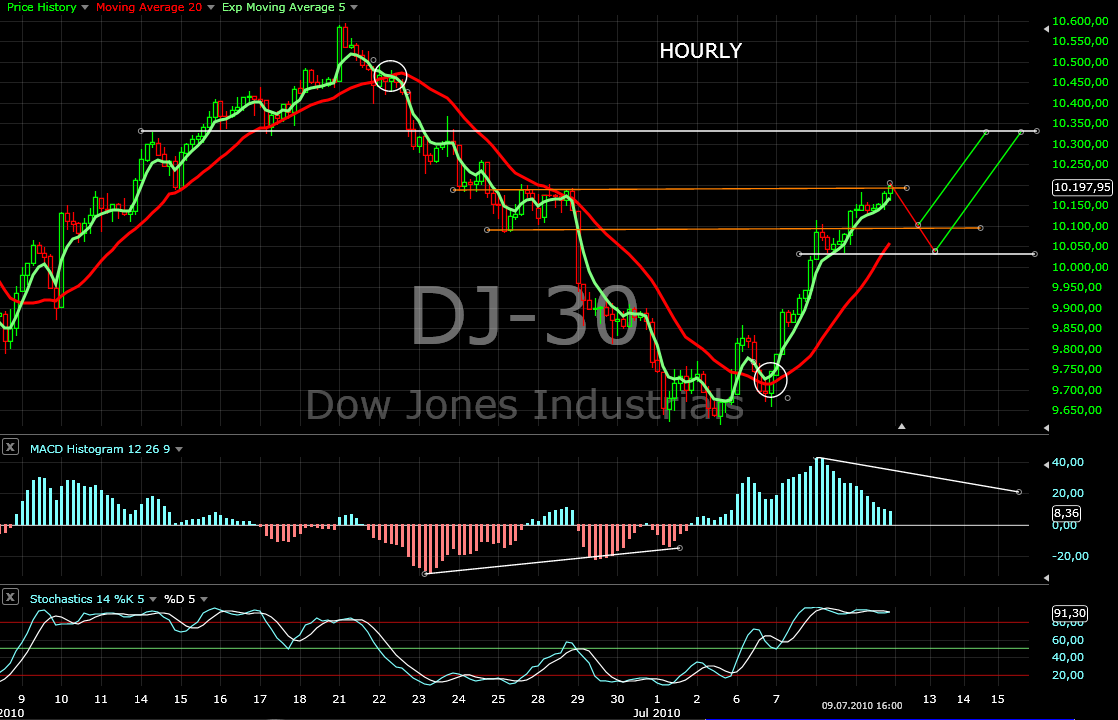
The second chart show the bearish scenario. The blogs are full with bearish Elliot waves counts. According this counts this is 2 of 3. If the bears are right the indexes should reverse soon and that very hard. In worst case we should see a little bit higher prices hitting resistance around 10320(shown on the third chart) and the trend line and than reverse hard never looking back making new lows. That is the personality of a third wave. Sorry but when I look at the indicators I do not see the beginning of a third wave.

The third chart shows my personal view. I think we will see a rally. The bears will get killed again. The bulls will think we are heading for a new highs. Then the market will complete its right shoulder and the whole Head&Shoulders formation and we will see correction of the move from March 2009

Do not forget the market tries to fool everybody. In fact no one knows what will happen. I am presenting you different scenarios and the market will reveal itself with the time. The best what we can do now is short term trading trying to squeze some profit, until the picture is more clear.
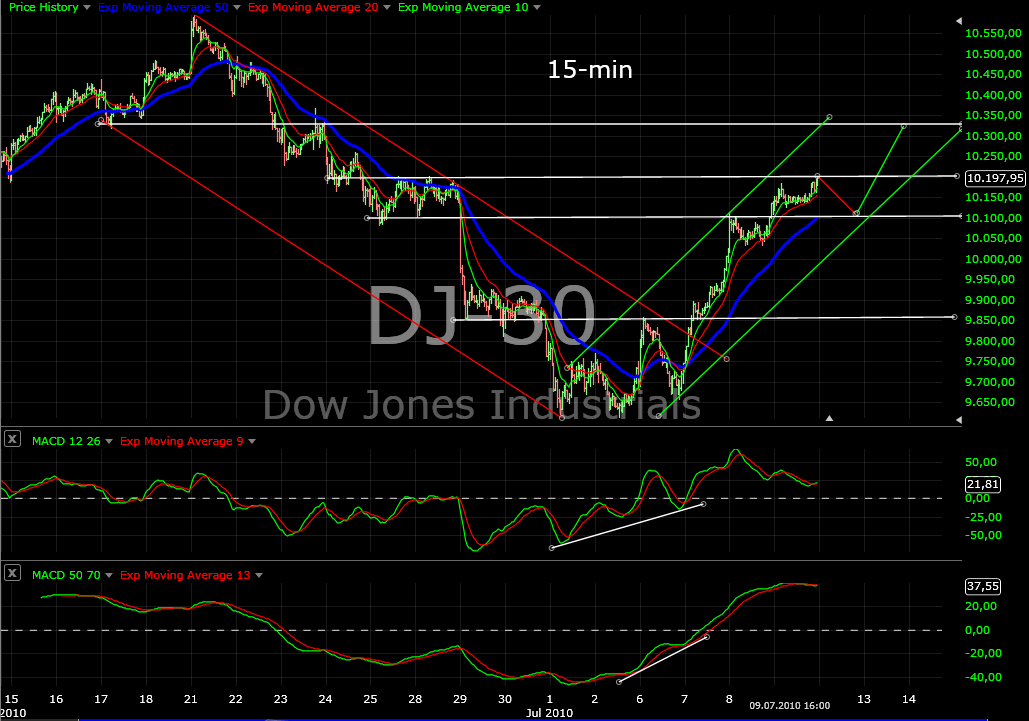
That is way I will start posting short term charts - 1h and 15min, trying to catch the shorter swings and maybe daytrading.


Bearish scenario


I little bit more bullish