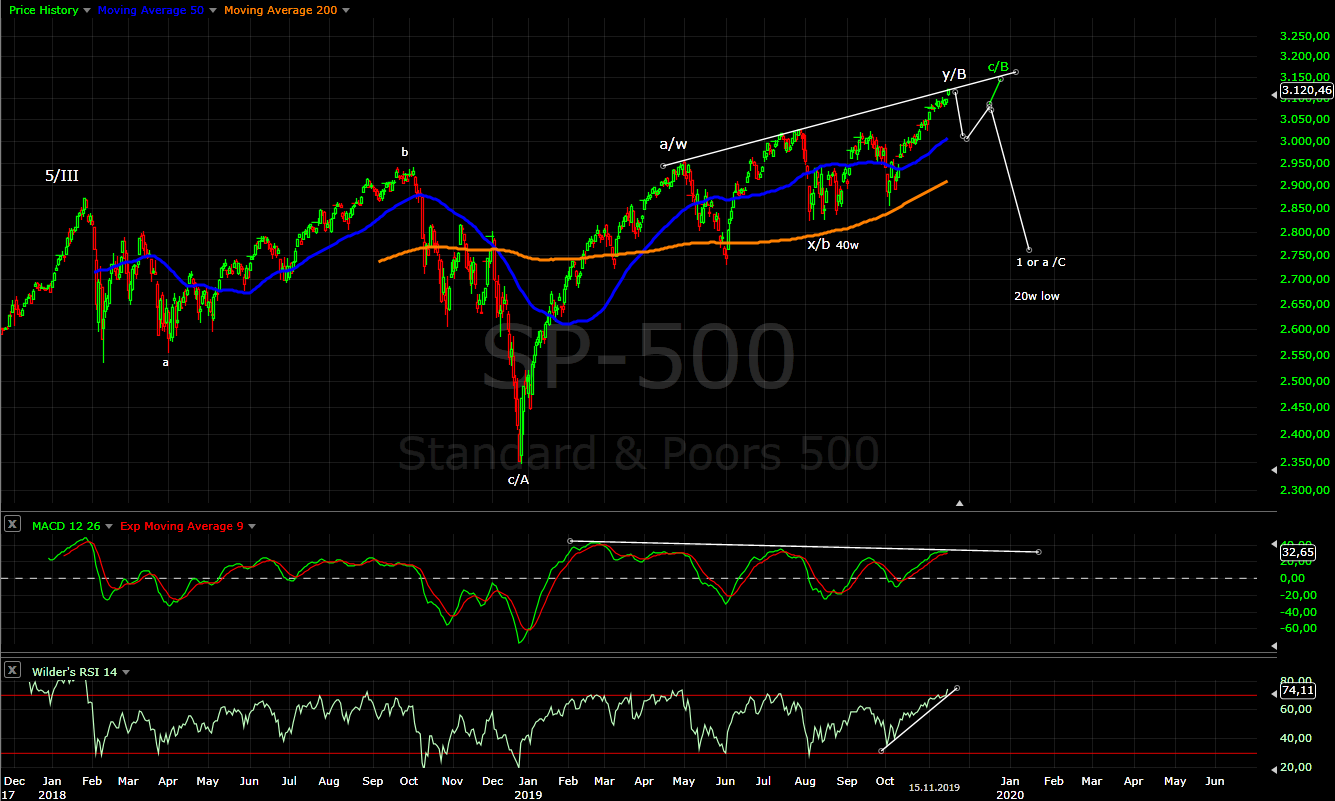
Volatile moves with a zig-zag lower, zig-zag higher and flat for the week. The pattern which makes most sense to me is to count another w4 and ED to complete the move from October and the whole B wave from Dec.2018. In this case expect another two weeks and 30 points higher for the ED to be completed - the Christmas rally. This will be great Christmas present if we see a high with ED - probably the most reliable pattern.
P.S. When I write the analysis my assumption is that the reader/trader has some trading system and rules for entry/exit point.
Obviously this is not the case for many and there is confusion about analysis,trading,trading plan,entry points. When I draw some line lower/higher this is not a trade. That is why on the daily cycle chart I will focus on trading with simple trading system, which should help beginners and clear the confusion analysis<->trading.
TECHNICAL PICTURE and ELLIOTT WAVES
Short term - with some creativity ignoring upper trend line and candle shadow you can draw another trend line and count w4. The move up is another zig-zag so most likely ED.
Alternate scenarios are flat or triangle, but then the creativity will not help... the correction will be too big to be part of this rally.
Intermediate term - expect two more touches of the the trend line in the next two weeks before the ED is completed. The indicators - just more divergences, one day and a half is too short to reset the indicators and erase the divergences. This is not an important low so that the indexes can re-energize and continue higher, this is topping.
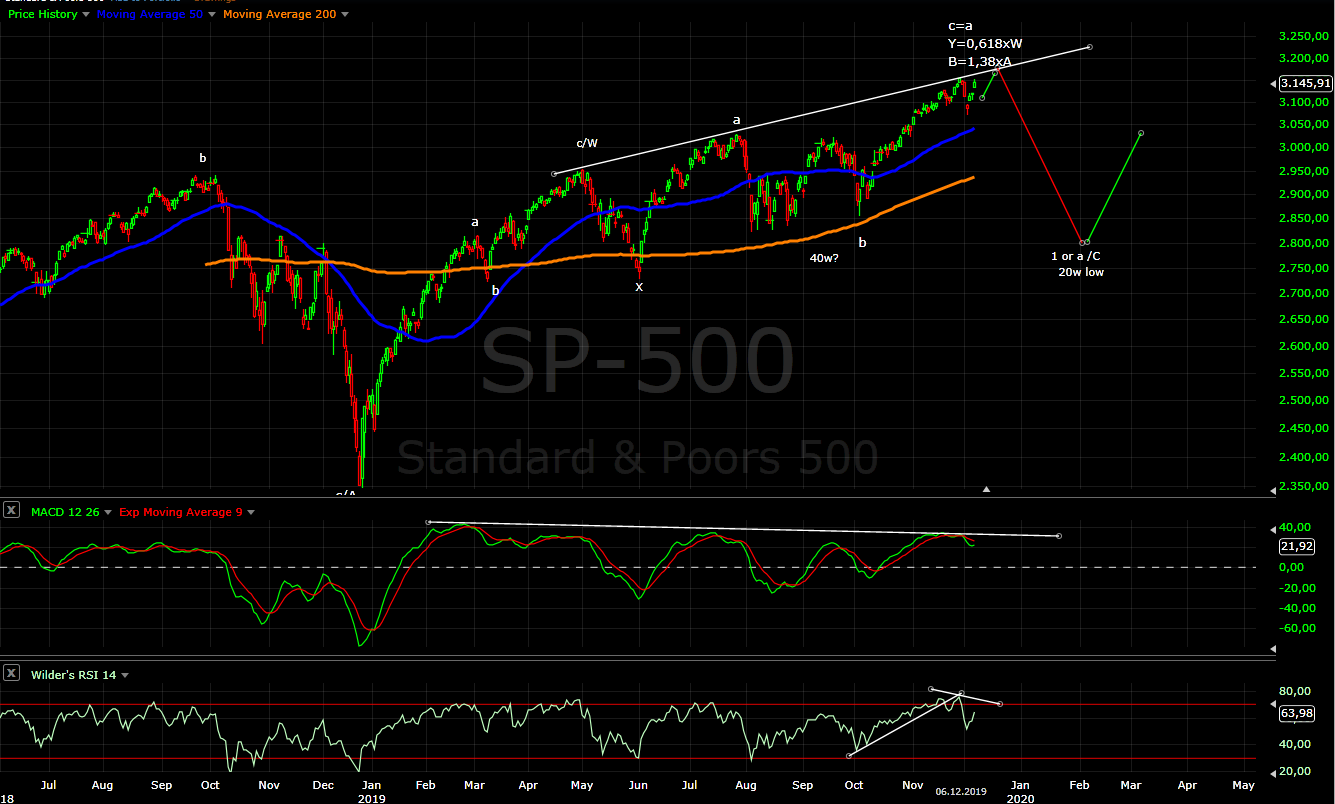
I find it interesting if you count w-x-y as shown on the chart you have a cluster of three different Fibo measurements in the same area. Such a cluster shows with very high probability the target area for a move and on top of this the count and measurements work for SP500/DJI/NYSE/NDX... fascinating, isn't it:)
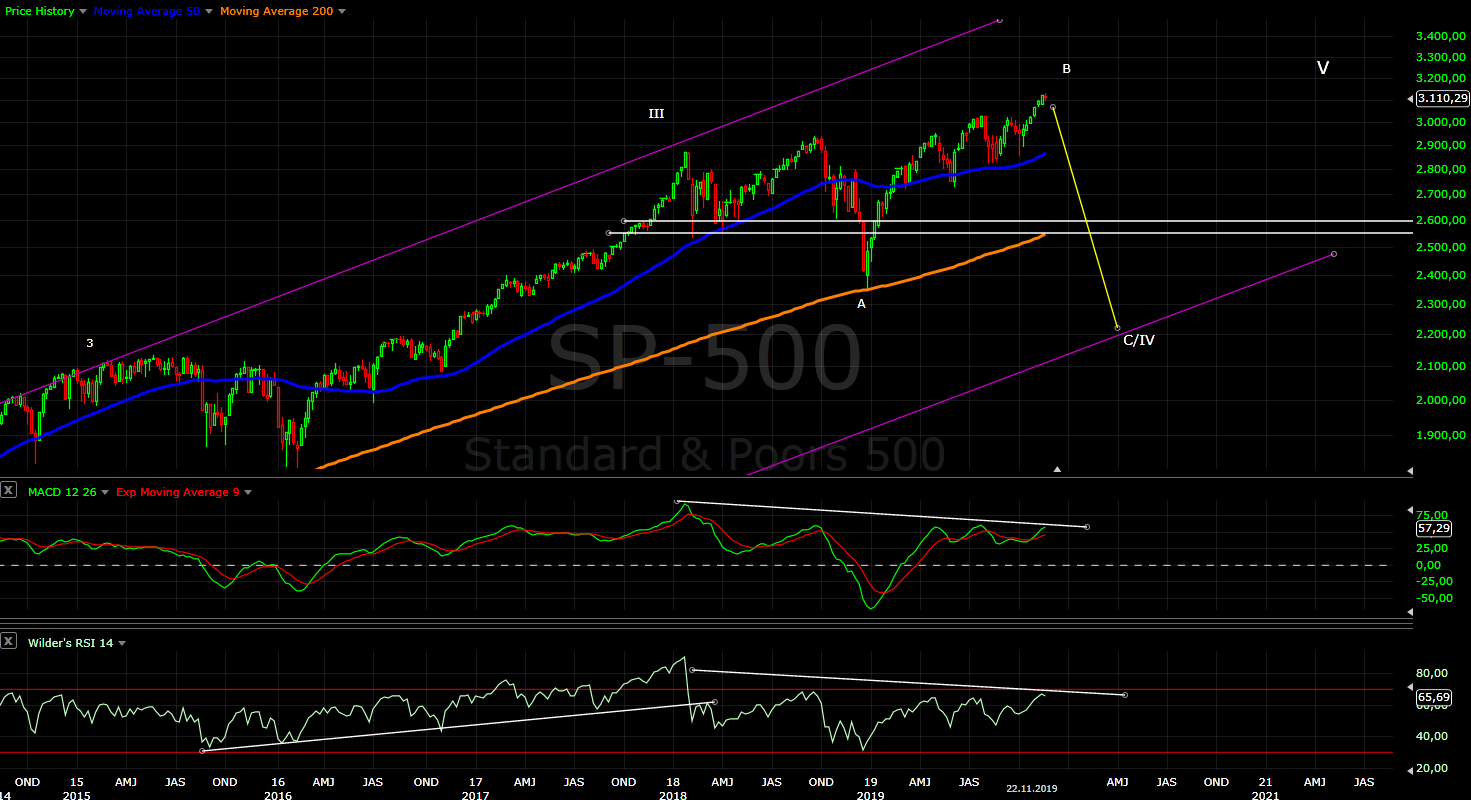
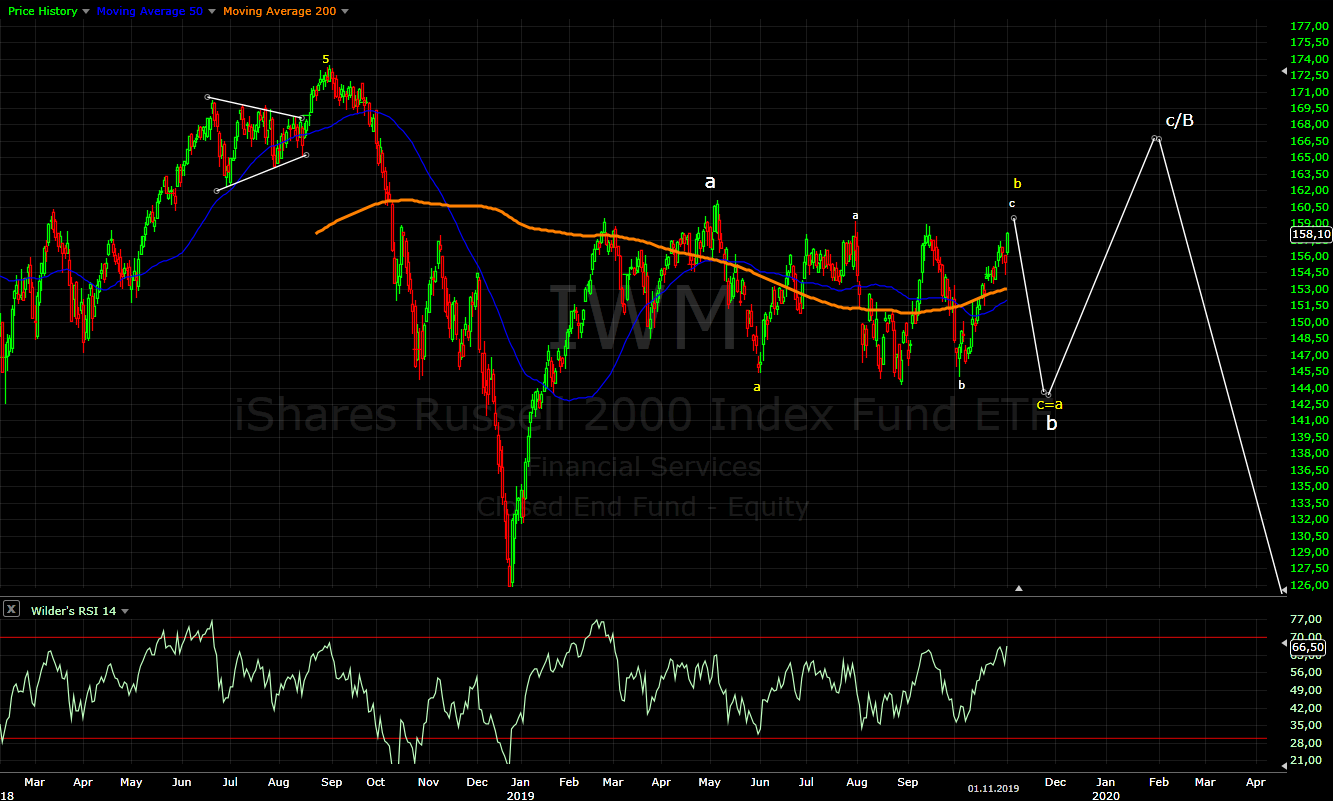
Long term - close to the top of wave B. When it is finished expect sell off to begin and to continue into Q2.2020. It will complete the correction which begun in January 2018. Alternate scenario a decline in three waves, but still a decline.
MARKET BREADTH INDICATORS
Market Breadth Indicators - very weak for a long time and going nowhere with multiple divergences.
McClellan Oscillator - above zero with multiple divergences.
McClellan Summation Index - sell signal with multiple divergences.
Weekly Stochastic of the Summation Index - sell signal.
Bullish Percentage - at the overbought level with multiple divergences.
Percent of Stocks above MA50 - at the overbought level with multiple divergences.
Fear Indicator VIX - spike higher as expected and now the low is tested, right on time for divergence and important high.
Advance-Decline Issues - in the middle of the range, preparing for another divergence.
HURST CYCLES
From now on I will focus on the cycle which I call daily cycle and stop mixing with Hurst cycles. This daily cycle is not Hurst cycle. Sometimes it corresponds to 80 day Hurst cycle sometimes not. It's focus is trading, it does not care about theory for example Hurst cycles if we have 40w low in August or October or EW what pattern we have etc.
It is simple, objective and effective - above MA10 is up, below MA10 is down. The idea is for traders without experience to stay on the right side of the trade:) and to make difference between analysis and trading. I explain over and over that drawing some line up or down is not a trade and I hear all the time - missed the move, wrong all the time, lost money because of you etc.
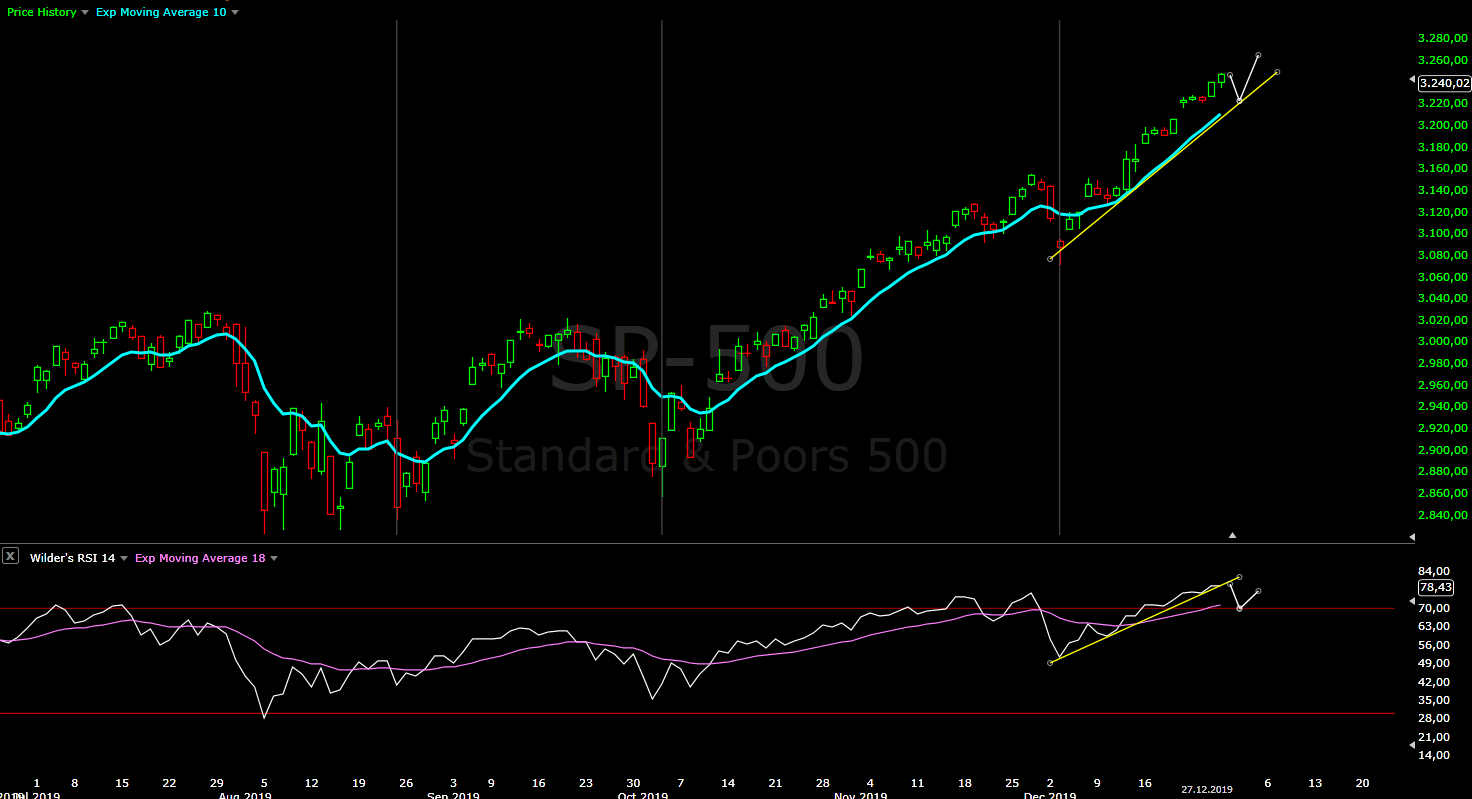
Daily cycle trading - the price broke below the trend line and MA10, RSI broke below the trend line and MA18. We have strong right translated cycle and we should expect one more higher high and "failed"(left translated) cycle. Usually a strong move is followed by higher high and a cycle which makes a top early and reverses(left translated).
The price/RSI moved above the the trend line and MAs and it seems the next daily cycle begun. My positioning now is - waiting.
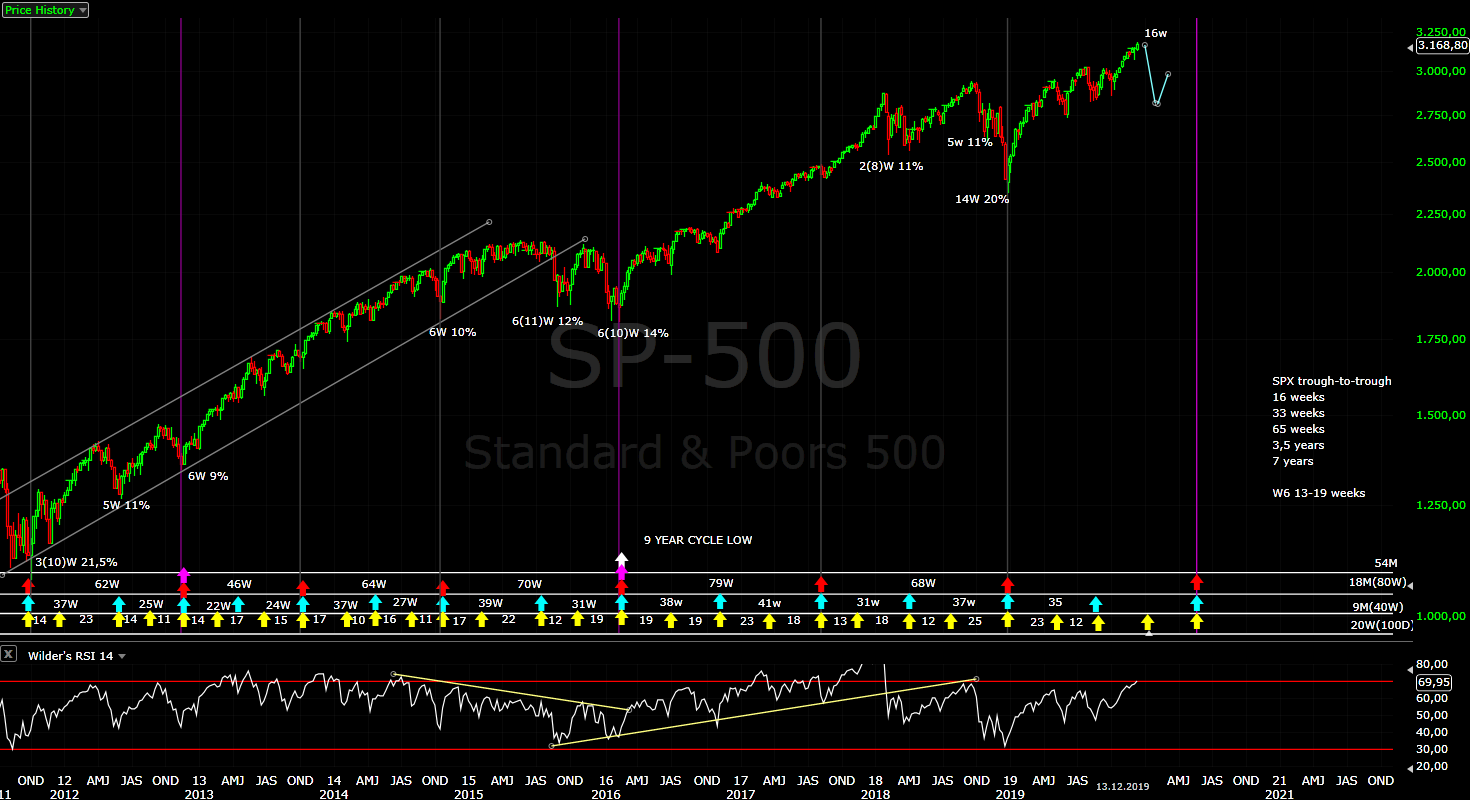
Monthly chart - the 4 year cycle consists according to the nominal Hurst model of 54 months and November was month 54. The indices are at 4 year cycle high - this is for those who think that the indices are going to accelerate north.... good luck with that.
Monthly chart TA look - bearish rising wedge, RSI broken trend line and testing it for the second time with double divergence again all this on monthly chart - the writing is on the wall.... for those who can read it.
Tom Demark SEQUENTIAL AND COUNTDOWN - this technique spots areas of exhaustion.
Weekly chart sell setup at 7, add two weeks for the ED and you have 9.... fascinating, isn't it:)