
Nov 30, 2017
Update
Bigger impulse, this is the top of wave 3.
Interesting Emerging markets do not follow, European markets do not follow, tech stock do not follow, VIX with a spike higher....

Nov 28, 2017
Update
It is not an ED it is a simple impulse... RSI says this is wave 3 there should be one more move lower and higher. NYSE,DJ,RUT have the same pattern.


Nov 25, 2017
Weekly preview
Short term view - next week the indexes should be lower.
Intermediate term view - the last wave higher from the August low is running.
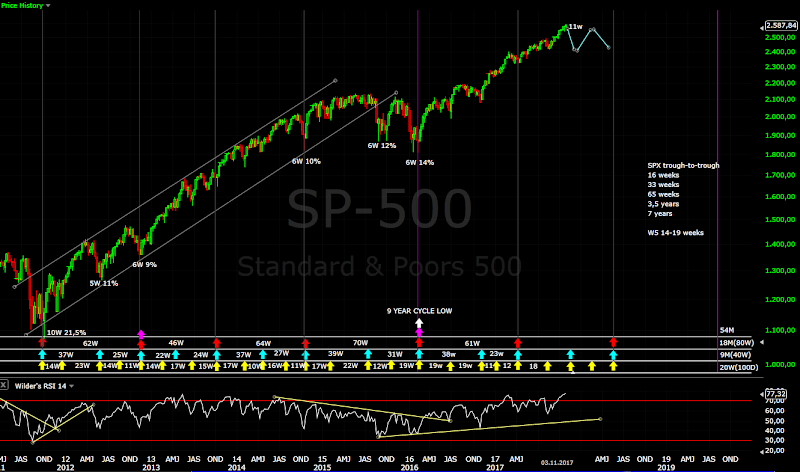
The indexes are higher as expected.... currently I see corrective waves up and down so I suspect some ED is running. Last week I have mentioned that cycles do not fit and relabel will be needed... I think we saw a stealth 40 week cycle low. You can see it if you loot at market breadth (McClellan Summation Index) and the price just moved sideways for 4 weeks. I have mentioned a few times that the move from the August low does not fit in the pattern... so there is an option that the move from the Feb.2016 is topping and this is wave 5 and not 3. This is shown on the daily chart, the Fibonacci measurements fit way too good to ignore it. TECHNICAL PICTURE and ELLIOTT WAVES
Short term - so far the move looks like a-b-c and the suspected pattern is ED. As long as the support area and MA200 hold it is ok... below this levels it is dangerous for the bulls.
Around tops the patterns is always not clear - alternate options are this is the top or sharp sell off to 2560 for flat correction or 1-2 i-ii and acceleration higher(not very likely).
Intermediate term - I want to see the histogram and RSI resetting higher before another turn lower. The bearish option is shown in red... Fibo way to perfect to ignore it.

Long term - even if this is the top it will be tested so no change, one more correction and a rally before turning very bearish.

MARKET BREADTH INDICATORS
Market Breadth Indicators - McClellan Summation Index very bearish for weeks suggesting that we are seeing important low(40 week cycle low), but Bullish Percentage never gave sell signal and price has not followed lower. Now most of the indicators are turning higher so I think cycles and market breadth are hinting move higher for a few weeks.
McClellan Oscillator - above zero for a while.
McClellan Summation Index - turned up and a buy signal.
Weekly Stochastic of the Summation Index - in oversold territory.
Bullish Percentage - positive, buy signal.
Percent of Stocks above MA50 - weak below 75.
Fear Indicator VIX - will we see the first higher low?
Advance-Decline Issues - turned up and moving higher.
HURST CYCLES
Day 6 of the 40 day cycle.

Week 1 of the next 20 week cycle if I am right about the 40 week cycle low.

Tom Demark SEQUENTIAL AND COUNTDOWN - this technique spots areas of exhaustion.
We a have a finished sell setup on the weekly chart and four weeks sideway move. For the next week price flip is a close below 2587.

Intermediate term view - the last wave higher from the August low is running.
The indexes are higher as expected.... currently I see corrective waves up and down so I suspect some ED is running. Last week I have mentioned that cycles do not fit and relabel will be needed... I think we saw a stealth 40 week cycle low. You can see it if you loot at market breadth (McClellan Summation Index) and the price just moved sideways for 4 weeks. I have mentioned a few times that the move from the August low does not fit in the pattern... so there is an option that the move from the Feb.2016 is topping and this is wave 5 and not 3. This is shown on the daily chart, the Fibonacci measurements fit way too good to ignore it. TECHNICAL PICTURE and ELLIOTT WAVES
Short term - so far the move looks like a-b-c and the suspected pattern is ED. As long as the support area and MA200 hold it is ok... below this levels it is dangerous for the bulls.
Around tops the patterns is always not clear - alternate options are this is the top or sharp sell off to 2560 for flat correction or 1-2 i-ii and acceleration higher(not very likely).

Intermediate term - I want to see the histogram and RSI resetting higher before another turn lower. The bearish option is shown in red... Fibo way to perfect to ignore it.

Long term - even if this is the top it will be tested so no change, one more correction and a rally before turning very bearish.

MARKET BREADTH INDICATORS
Market Breadth Indicators - McClellan Summation Index very bearish for weeks suggesting that we are seeing important low(40 week cycle low), but Bullish Percentage never gave sell signal and price has not followed lower. Now most of the indicators are turning higher so I think cycles and market breadth are hinting move higher for a few weeks.
McClellan Oscillator - above zero for a while.
McClellan Summation Index - turned up and a buy signal.
Weekly Stochastic of the Summation Index - in oversold territory.
Bullish Percentage - positive, buy signal.
Percent of Stocks above MA50 - weak below 75.
Fear Indicator VIX - will we see the first higher low?
Advance-Decline Issues - turned up and moving higher.
HURST CYCLES
Day 6 of the 40 day cycle.

Week 1 of the next 20 week cycle if I am right about the 40 week cycle low.

Tom Demark SEQUENTIAL AND COUNTDOWN - this technique spots areas of exhaustion.
We a have a finished sell setup on the weekly chart and four weeks sideway move. For the next week price flip is a close below 2587.

Nov 22, 2017
Update
I think since the end of October all this corrective waves are one much bigger ED than I thought.
 NYSE and DJ look a little bit different so alternate the ED could look this way. It will take more time, but at the end it is the same story. I suspect stealth 40 week cycle low last week so spending time a few weeks higher is in fact what I want to see.... and you will have your Christmas rally:) the last high before puking hard lower.


Nov 19, 2017
Weekly preview
Short term view - a little bit lower and then higher.
Intermediate term view - the move from the August low is topping. When it is over a few weeks lower for 40 week cycle low.
SP500 moved lower as expected, but I can not see an impulse and I warned about the short term low. The pattern which makes sense at the moment is wave 5 from the August low. I looked at different indexes they all have different patterns, but the common is more to the upside no matter corrective move or higher highs. The bigger picture has not changed the market is topping and correction for a few weeks is expected. TECHNICAL PICTURE and ELLIOTT WAVES
Short term - I do not see a way to twist this move lower as an impulse. The most likely scenario is wave 5 from the August low. The Fibo measurements are ok - wave 3 with max extension and wave 4 with 0,236 retracement which is expected when you have extended wave 3. In the update I have shown this area around 2565 - it was tested 4 times and we have false break lower... as long as this level holds and we do not see a clear move lower and close below it, close below the trend line and MA200, expect more to the upside. RSI broke the trend line higher which means the move lower is over. In a bearish scenario it is wave 2(red) or x double zig-zag. Even in this case the support level should hold and the top should be tested.

Intermediate term - the indicators plunged lower, but the price has not followed. The histogram is below zero for a month... this is not the way a reversal and a sell off begins. I think it is more likely to see the indexes at least for a few days higher, RSI testing the trend line, the histogram around zero or above, before another move lower.

Long term - no change, one more correction and a rally. For now the plan is that this is the high of wave 3 from the Feb.2016 low. When we see the move lower we will know if this is the right pattern.

MARKET BREADTH INDICATORS
Market Breadth Indicators - look bearish, pointing lower for weeks. The price is not following so far which fits with the cycle picture - any correction should be short living 2-3 weeks.
McClellan Oscillator - spending a lot of time below zero already and now trying to move into positive territory.
McClellan Summation Index - sell signal .
Weekly Stochastic of the Summation Index - sell signal, reached oversold levels.
Bullish Percentage - flat for a long time right above 70.
Percent of Stocks above MA50 - tested the middle of the range, one more high with divergence?
Fear Indicator VIX - jumped to 14 now I expect a higher low.
Advance-Decline Issues - I think it is topping.
HURST CYCLES
Day 17... confusing, if the indexes make higher high relabel will be necessary.

Week 13 of the 20 week cycle. It should turn lower for 2-4 weeks soon.

Tom Demark SEQUENTIAL AND COUNTDOWN - this technique spots areas of exhaustion.
We a have a finished sell setup on the weekly chart and four weeks sideway move. For the next week price flip is a close below 2581.

Nov 15, 2017
Update
The indexes are moving lower, but the pattern is a mess. There is serious battle around 2565 and four candles with long tails.... the futures are testing the level again.
There is two options - the price accelerates lower to the lower support level/MA50 or short term bottom and higher probably until Thanksgiving. RSI sharply lower around 50 and far away from the trend line, in Europe the indexes finished impulse lower and testing MA50..... the odds are higher that this is a short term bottom.
If we do not see a move below 2565 and SPX closing below 2565 near the low for the day... than we have a short term bottom.
 With no clear impulse I see two options either a-b-c for wave 4 and 5 higher(green) or diagonal for 1/A and testing the top 2/B(red).


Nov 11, 2017
Weekly preview
Short term view - lower, target around support 2545 and MA50.
Intermediate term view - the odds are very high that the move from the August low is over and probably this is the top of wave 3 from the Feb.2016 low. I expect lower for a few weeks and 40 week cycle low around mid December.
SP500 levitated for another three days, but broke lower as expected. In the last 5 weeks we saw two EDs lasting two weeks each. The index gained 1,5% for this time.... this does not look like strong bullish action more like exhaustion. The signs are not very good for the bulls - EW two EDs in a row, the indicators spent the time building divergences and not resetting lower, market breadth is bearish, the new 40 day cycle made higher high as expected but with 1/3 behind us instead to be the strongest part all we see is marginal high and sideway move, TomDemark finished sell setup on the weekly chart. I can not present bullish arguments at the moment.... except faith - the market will always move higher and never correct. This does not mean the indexes will crash and burn just purge some greed. Short term we have MA50 support on the daily chart and in a few weeks 40 week cycle low sometimes in December. TECHNICAL PICTURE and ELLIOTT WAVES
Short term - looking at the daily indicators and the 40 day cycle with 1/3 behind us another high unlikely. The European indexes already with impulse lower the US indexes still need to confirm a reversal, but I think they will move lower .

Intermediate term - another finished ED and RSI/MACD divergences. The move from the August low should be over.

Long term - no change, one more correction and a rally. For now the plan is that this is the high of wave 3 from the Feb.2016 low. When we see the move lower we will know if this is the right pattern.

MARKET BREADTH INDICATORS
Market Breadth Indicators - look bearish, pointing lower, with sell signals since last week.
McClellan Oscillator - spending a lot of time below zero already.
McClellan Summation Index - sell signal.
Weekly Stochastic of the Summation Index - sell signal.
Bullish Percentage - sell signal with small divergence and below MA10, but still above 70.
Percent of Stocks above MA50 - sell signal below 75.
Fear Indicator VIX - extreme complacency again, double bottom?
Advance-Decline Issues - cumulative A/D with divergence and pointing lower.
HURST CYCLES
Day 12 of the 40 day cycle. On Friday SP500 closed below MA10 and the trend line, which means the odds are higher that the current 40 day cycle made a top and turned lower.

Week 12 of the 20 week cycle. It should turn lower for 2-4 weeks. Average length is 14-18 weeks. With the previous one 18 weeks long a shorter one 16 weeks will look better. This means mid December and time for Christmas rally:)

Tom Demark SEQUENTIAL AND COUNTDOWN - this technique spots areas of exhaustion.
We a have a finished sell setup on the weekly chart, but no price flip so far. For the next week price flip is a close below 2575.

Nov 4, 2017
Weekly preview
Short term view - lower next week, then we will see if this is the top or not.
Intermediate term view - close to the top of wave 3 from the Feb.2016 low.
SP500 working on fifth wave as expected.... I am not sure if this is the top or we will see one more high. You can count the price action from the August low as finished, but another count with one more high is possible. Every index looks different so it is not easy to use other indexes as a reference. It is always the same around tops/bottoms you never know if you will see one final push or not. TECHNICAL PICTURE and ELLIOTT WAVES
Short term - SP500 looks toppy. I expect the index to turn lower on Monday or Tuesday. I do not know if this is the top or not, first I want to see how a move lower looks like.

Intermediate term - close to the top of wave 3.... waiting for reversal signature. RSI broke the trend line and now working on a divergence.

Long term - no change, waiting for the top of the current leg higher then one more correction and a rally.
I have some suspicions that this could be the top of the move from the Feb.2016 low. No need to get bearish now, the top will be tested.
MARKET BREADTH INDICATORS
Market Breadth Indicators - look very bad. The indicators do not follow the market higher any more. A/D issues and NH-NL are heading lower when the market is heading higher - big red flag.
McClellan Oscillator - spending a lot of time below zero already.
McClellan Summation Index - sell signal.
Weekly Stochastic of the Summation Index - sell signal.
Bullish Percentage - sell signal with small divergence and below MA10, but still above 70.
Percent of Stocks above MA50 - very weak, below 75 heading lower while the indexes are making higher highs.
Fear Indicator VIX - extreme complacency again, double bottom?
Advance-Decline Issues - below zero. For the first time in 2017 Advance-Decline Issues cumulative is pointing lower while the indexes are moving higher.
HURST CYCLES
Day 7 of the 40 day cycle. As expected after strong rigth translated cycle another higher high follows.

Week 11 of the 20 week cycle.
Tom Demark SEQUENTIAL AND COUNTDOWN - this technique spots areas of exhaustion.
We a have a finished sell setup on the weekly chart, but no price flip so far. For the next week price flip is a close below 2553.

Intermediate term view - close to the top of wave 3 from the Feb.2016 low.
SP500 working on fifth wave as expected.... I am not sure if this is the top or we will see one more high. You can count the price action from the August low as finished, but another count with one more high is possible. Every index looks different so it is not easy to use other indexes as a reference. It is always the same around tops/bottoms you never know if you will see one final push or not. TECHNICAL PICTURE and ELLIOTT WAVES
Short term - SP500 looks toppy. I expect the index to turn lower on Monday or Tuesday. I do not know if this is the top or not, first I want to see how a move lower looks like.

Intermediate term - close to the top of wave 3.... waiting for reversal signature. RSI broke the trend line and now working on a divergence.

Long term - no change, waiting for the top of the current leg higher then one more correction and a rally.
I have some suspicions that this could be the top of the move from the Feb.2016 low. No need to get bearish now, the top will be tested.

MARKET BREADTH INDICATORS
Market Breadth Indicators - look very bad. The indicators do not follow the market higher any more. A/D issues and NH-NL are heading lower when the market is heading higher - big red flag.
McClellan Oscillator - spending a lot of time below zero already.
McClellan Summation Index - sell signal.
Weekly Stochastic of the Summation Index - sell signal.
Bullish Percentage - sell signal with small divergence and below MA10, but still above 70.
Percent of Stocks above MA50 - very weak, below 75 heading lower while the indexes are making higher highs.
Fear Indicator VIX - extreme complacency again, double bottom?
Advance-Decline Issues - below zero. For the first time in 2017 Advance-Decline Issues cumulative is pointing lower while the indexes are moving higher.
HURST CYCLES
Day 7 of the 40 day cycle. As expected after strong rigth translated cycle another higher high follows.

Week 11 of the 20 week cycle.

Tom Demark SEQUENTIAL AND COUNTDOWN - this technique spots areas of exhaustion.
We a have a finished sell setup on the weekly chart, but no price flip so far. For the next week price flip is a close below 2553.

Subscribe to:
Posts (Atom)