Intermediate term view - waiting the choppy move to finish and a correction for 2-4 weeks.
"The pullback" was just a sideway move in a 10 points range.... and the target 1920 was hit.
The forecast - this should be wave 3 of ED and wave 4 lower to 1860 +-10 should start next week. It is based on EW and cycles - see the previous post.
I am following the pattern for months and for 4-5 weeks I have mentioned the target 1920 - we are here now.... SP500 looks strong, break out, another rally bla bla the usual bullish stuff.
Now before throwing out the forecast through the window:) I will wait to see what happens next week. In fact if you look at DJ or Russell2000 they do not look so strong. DJ did not made a new ATH.... probably it will squeeze it next week before a reversal.
Do not forget trading is something different and the plan is very easy now - long until you see lower high or higher high with divergences. When you see this there is high probability that this will be a pullback to around 1860 and than you can try short trade.
TECHNICAL PICTURE
Short term - 1-2-3-4-5 is the ED. There is no signs for a reversal. On the chart is shown what should we see if the forecast is right and we see a short term top followed by wave 4 of the ED.

Intermediate term - this is the ED idea... we will see if it works.

- Momentum Histogram/RSI - momentum is up.
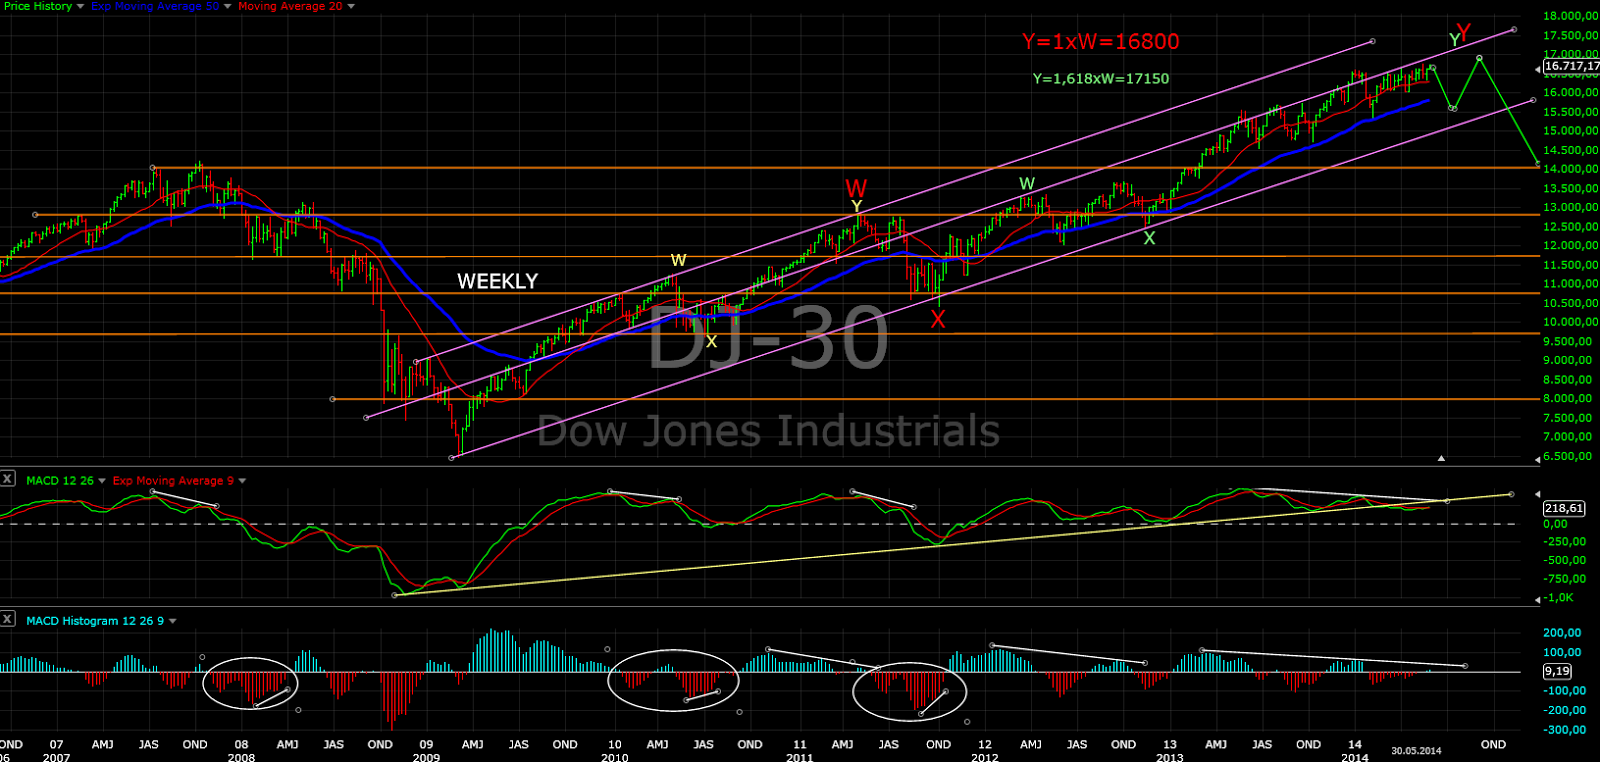
Long term - I do not think that any move higher will clear the MACD divergence and start another long lasting rally. I think the next big move will be lower, but it could last months until we reach this point.
- Momentum Histogram/RSI - momentum is up.
MARKET BREADTH INDICATORS
The Market Breadth Indicators - are pointing up, but no signs of a strength..... only high complacency.
McClellan Oscillator - nothing interesting....
McClellan Summation Index - buy signal, but could not really move strong higher. Still lower high.
Weekly Stochastic of the Summation Index - neutral....
Bullish Percentage - above 70... buy signal. Long term divergences flashing red.
Percent of Stocks above MA50 - managed to move above 75... the nex lower high?
Fear Indicator VIX - extreme complacency.... just a hundredth from the lowest reading for the whole bull market.
Advance-Decline Issues - moved up, but not convincing at all.
Put/Call ratio - I suspect the next lower high....
Percent of Stocks above MA200 - another lower high....
HURST CYCLES
Day 33 - we should see the indexes moving lower soon towards the expected 40 day and 80 day cycle low.

Waiting for a correction to finish the 20 week cycle....

Tom Demark SEQUENTIAL AND COUNTDOWN - this technique spots areas of exhaustion.
At 7 of a sell setup. There is high probability it will be finished. Wait for a price flip if you want to short.

It is interesting that even with all this choppy moves we have 6 of a setup on the weekly chart. I will be surprised if it would be finished, but who knows.....


