May 30, 2015

Weekly review

Short term view - lower before a bottom.
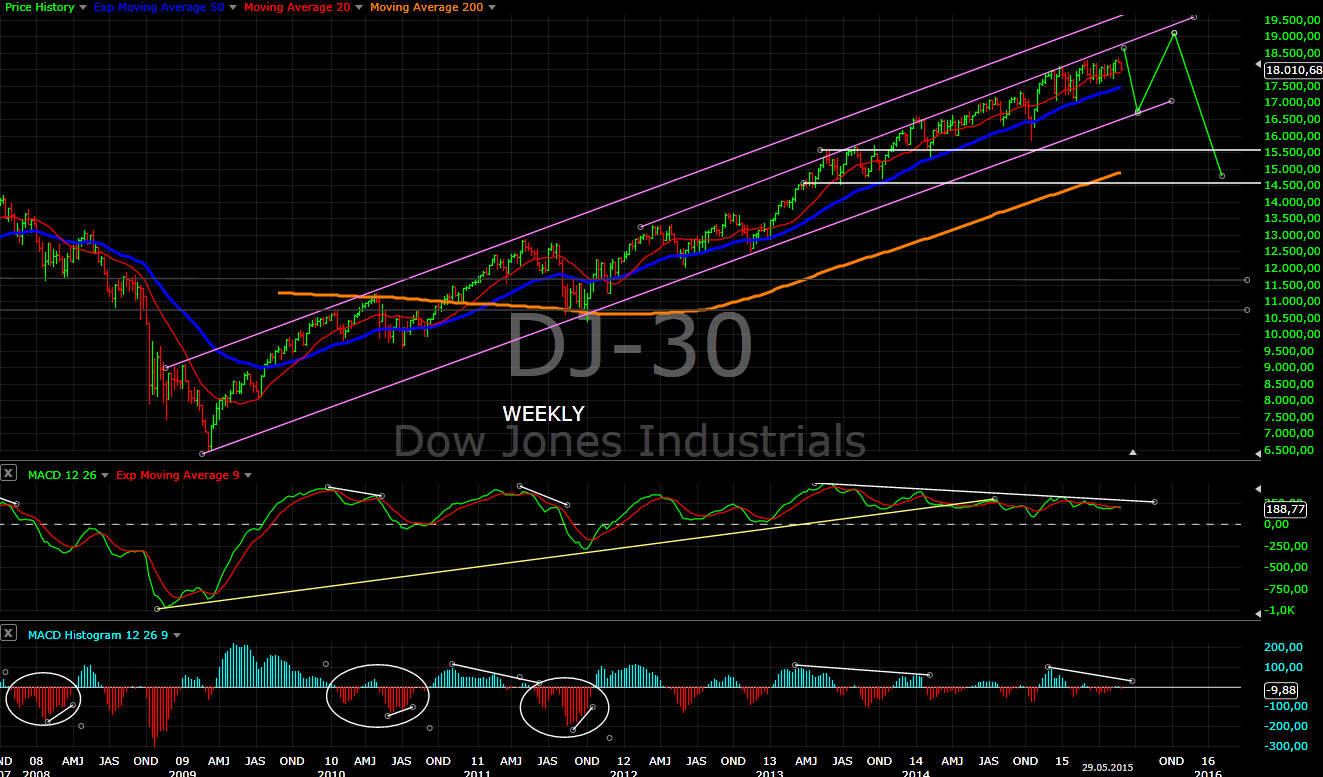
Intermediate term view - I am not convinced that this is the top of the wedge... I think we will see one more ATH in June

The indexes moved lower as expected and for now are following the road map which I have shown on Tuesday. We still have not reached the point to say for sure which scenario is playing out, but I think we will see one more high before a significant correction.

The "mess" is now running for six months. I have read about the NYSE margin debt this weekend. It shot up substantially higher in 2015 and the price moved nowhere. A lot of buying is met with selling. This means for me distribution. This fits with the pattern and my expectation for a significant correction.
Here are the data from NYSE... simple chart and if you want to read more.

TECHNICAL PICTURE
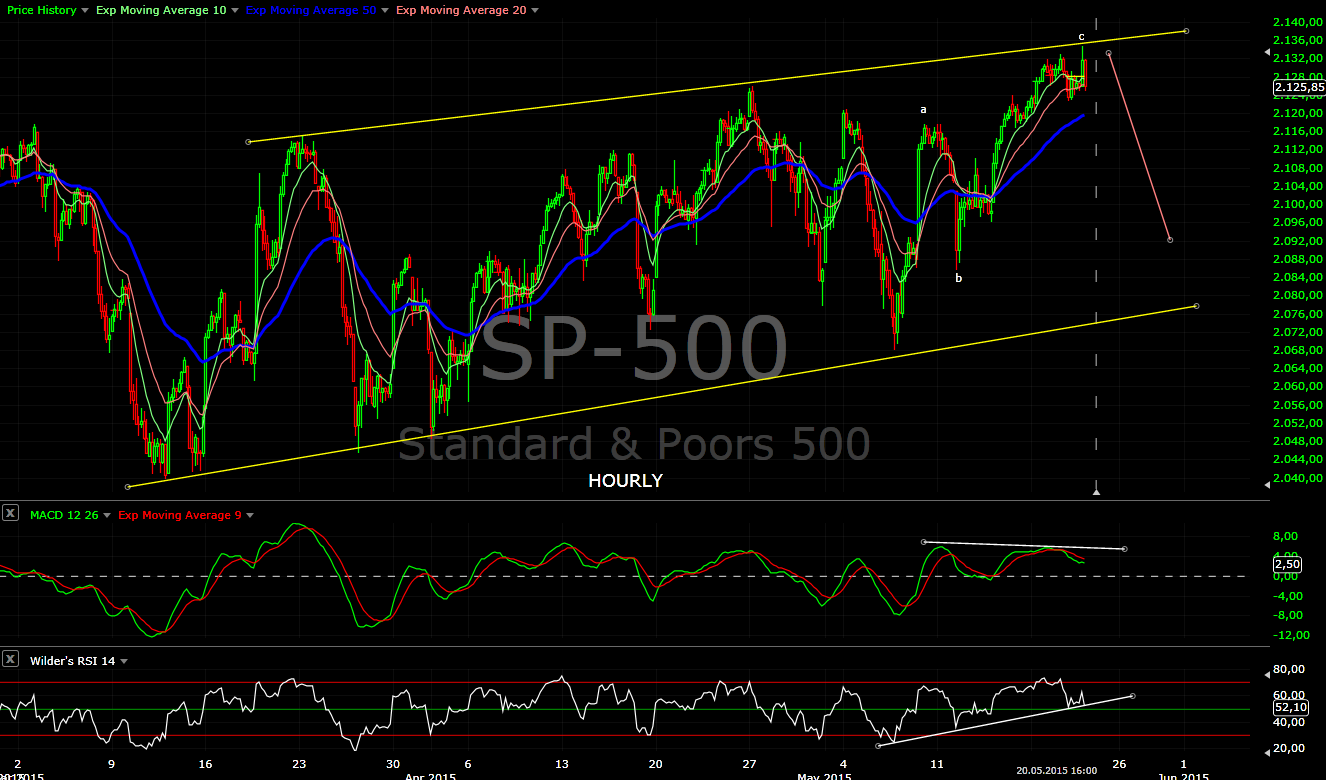
Short term - the support level 2120-2125 has been broken and tested. One more push lower to finish a corrective move will look great. The measurement points to 2090.
As long as the price stays below 2120-2125 the move is bearish. Move below 2080 will be very suspicious... that the red scenario is running.


Intermediate term - I think we will see one more high... now waiting to see how the move lower will look like.


Long term - no change


MARKET BREADTH INDICATORS
The Market Breadth Indicators - are bearish, but not bearish like important watch out... rather a correction is running.
McClellan Oscillator - bearish below zero.
McClellan Summation Index - sell signal.
Weekly Stochastic of the Summation Index - sell signal, but in oversold territory. The move is near it's end.
Bullish Percentage - sell signal but nothing really convincing.
Percent of Stocks above MA50 - in the middle of the range, a mess like the indexes.
Fear Indicator VIX - long term higher lows... wedging too.
Advance-Decline Issues - in the middle of the range.


HURST CYCLES
Day 44 and waiting for a low of the 40 day cycle in the next days.

A move lower for 1-2 weeks will look perfect to finish the 20 week and 40 week cycle.
P.S. probably I will have to change the count with the next low only as 40 week low and not 18 month low.


Tom Demark SEQUENTIAL AND COUNTDOWN - this technique spots areas of exhaustion.
Setup lower at 5 is running. On Monday closing 3-4 point lower and we will have 6 and higher probability the setup to be finished.


Every index has it's own version of the wedge which deviates a little bit. I think NYSE has the best shape compared to the other indexes where the ED is not so well visible.

May 26, 2015

Update

It is too early to say which scenario is playing out. This is just a road map how a bullish and bearish scenario should look like. We will watch how the move is developing and we will know what is going on.

More bullish(green) - wave 5 of the ED/wedge is running. All waves should be corrective, series of threes and when you project them we should see a low around 2085 +- several points and high around 2155 +- several points. Interesting is that 2155 is perfect touch of the upper trend line of the wedge(see the chart below).
More bearish(red) - if the ED/wedge is finished, we should see sharp move lower impulse and the first significant bounce should come at support and MA200 around 2040(see the chart below).

The daily chart.... the bears should move the prices sharply lower below MA50 and the lower trend line, if the wedge is not finished the price should make a low around MA 50 and the wedge trend line after a choppy week.

May 25, 2015

Weekly review

Short term view - short living spike higher and than move lower.
Intermediate term view - I am not convinced that this is the top of the wedge...

The indexes made new ATH as expected, but this is really a very weak move part of the wedge/ED and not some kind of a break out and rally. Now let's see if something to the downside will follow and how it will looks like.

Nothing new - the two scenarios are this is the top of the wedge or one more high will follow.
It is prudent to take profits. It is not worth the risk to wait for another high which will be 10-20 points higher than the current one.

TECHNICAL PICTURE
Short term - it looks like we have a small triangle above MA50 and last final spike before reversal is missing
The short term support levels are 2123 and 2117. Aggressive short term traders can use them to short, for the others wait to see a confirmation - impulse lower and retracement.


Intermediate term - I think we will see one more high... now waiting to see how a move lower will look like.


Long term - no change.


MARKET BREADTH INDICATORS
The Market Breadth Indicators - neutral or bearish... I think short living move lower is to be expected.
McClellan Oscillator - moved below zero despite the new ATH... bearish.
McClellan Summation Index - sell signal
Weekly Stochastic of the Summation Index - sell signal but in oversold territory. 1-2 weeks lower for a bottom?
Bullish Percentage - sell signal,but not really convincing.
Percent of Stocks above MA50 - neutral in the middle of the range.
Fear Indicator VIX - long term higher lows... wedging too.
Advance-Decline Issues - neutral in the middle of the range.


HURST CYCLES
The top of the 40 day cycle should be behind us... waiting to see something to the downside for 40 day cycle low.

A move lower for 1-2 weeks will look perfect to finish the 20 week and 40 week cycle.
P.S. probably I will have to change the count with the next low only as 40 week low and not 18 month low.


Here is another index NYSE. Pick one scenario:) The truth is you can not say which one has higher probability. I think we will see one more high, but I can not present you convincing arguments... just feeling watching the different indexes in Europe and USA.

May 21, 2015

Update

Five waves for c... three waves for a-b-c... we are in a wedge do not expect more than three waves up or down. The upper trend line reached and this could be 5 of the wedge/ED.... so it is time to take the money off the table.

May 17, 2015

Weekly review

Short term view - more to the upside
Intermediate term view - we will see something to the the downside, but I do not think this is the top.

Nothing new the mess continues.... the last two months even in a tighter range with slightly upward slope. I think the whole move will continue longer than I have expected:( probably till mid June... more patience is needed.

There is two scenarios - the wedge will top after one more ATH or this will be only point 3 with 4 and 5 to follow - see the last chart NASDAQ the wedge is more clear.
Technical analysis, EW, Market breadth can not help us to say unambiguous there is one more wave 4 and 5 left or not. The cycles will look much better with move lower for 1-2 weeks to finish the current 40 day and 40 week cycles and than higher again.
So I looked at the other indexes. Russell2000 shows impulse lower and the NASDAQ broke the trend line and is testing it from below - that means for me do not expect a rally higher rather marginal new ATH(SP500/DJI) followed by a move lower.
When an ED/Wedge is finished a sharp move lower begins... look at now the NASDAQ again.If 5 is behind us I expect to see a strong move impulse lower to the support level. Instead the move was corrective three waves. So this should be rather an a-b-c for wave 4 of the ED than a bigger correction. In Europe the DAX and CAC40 look like one final wave 5 is missing and I doubt that we will see 10% correction in the US markets and Europe moving 10% higher at the same time.

Based on the thoughts above the plan is - marginal new ATH, move lower (4 of the ED) and another move higher to finish the wedge. All this will last probably one month.
If we see a strong move lower impulse than we will switch to the scenario that the wedge is finished.

TECHNICAL PICTURE
Short term - I do not know if the indexes will just continue higher the a-b-c or make something more complex the w-x-y. But I think they are not finished to the upside.


Intermediate term - changed the plan, now it looks like this will be only point 3 of the wedge and we will keep an eye on the move lower when we see such.


Long term - no change.


MARKET BREADTH INDICATORS
The Market Breadth Indicators - neutral or bearish... I think short living move lower is to be expected.
McClellan Oscillator - positive(but lower high)... rebound after oversold levels.
McClellan Summation Index - sell signal
Weekly Stochastic of the Summation Index - sell signal
Bullish Percentage - sell signal
Percent of Stocks above MA50 - neutral in the middle of the range.
Fear Indicator VIX - long term higher lows... wedging too
Advance-Decline Issues - neutral in the middle of the range.


HURST CYCLES
There is different ways to count the cycles with the flat move in the last two months.... the best look will be to see a move lower to finish the 40 day/20 week/40 week cycle.

A move lower for 1-2 weeks will look perfect to finish the 20 week and 40 week cycle. P.S. probably I will have to change the count with the next low only as 40 week low and not 18 month low.


Tom Demark SEQUENTIAL AND COUNTDOWN - this technique spots areas of exhaustion.
Nothing interesting with this mess for months....

RUSSELL2000 - impulse lower to support and 50% Fibo retracement testing MA50 from below, expect more to the downside.


NASDAQ - broken trend line, but the move lower is only a three wave corrective. Probably wave 4

May 1, 2015

Weekly review

Short term view - more to the downside with a bounce up next week Monday Tuesday.
Intermediate term view - I think this will be a shallow correction before testing the highs again.

This time earlier, I am away this weekend and next week I do not know if I will have time to post something.
As expected SP500 hit ATH and reversed even lower than my target:)

This move does not look like a strong impulsive move. There will be more to the downside probably two weeks. For now I will just watch how the move develops....

TECHNICAL PICTURE
Short term - difficult to predict the exact path... short term traders should short moves up.


Intermediate term - so far it looks to me like a correction, but not a big one. Targets are the previous lows 2040 ans 1980-1990.


Long term - no change


MARKET BREADTH INDICATORS
The Market Breadth Indicators - are bearish.
McClellan Oscillator - outside the BB move up expected.
McClellan Summation Index - sell signal
Weekly Stochastic of the Summation Index - neutral
Bullish Percentage - sell signal
Percent of Stocks above MA50 - I think it will visit the lower range.
Fear Indicator VIX - long term higher lows.
Advance-Decline Issues - I think it will visit the lower range.


HURST CYCLES
High probability that we saw the top of the current 40 day cycle. We should see 2-3 weeks lower.

The same story on the weekly chart - week 13 and average length 14-16 week for the cycle... so 1-3 weeks lower expected


Tom Demark SEQUENTIAL AND COUNTDOWN - this technique spots areas of exhaustion.
Setup lower is running currently day 2.


And Russell2000 hit the target 1279 and reversed.