Jan 27, 2024

Weekly preview

This week the price is higher, but it feels like distribution. For example NDX has three days gapping up and selling starts closing below the open and the week ended with shooting star candle. Gap lower next week and red weekly candle will be bearish pattern. In contrast NYSE has strong weekly candle and managed to move above the last minor high.
So mixed signals, but I would say one more 20d cycle high. We have 20d high and now decline into 20d low... probably a low around FOMC and final high after that.


TRADING
Trading trigger - buy signal.
Analysis - final wave completing the correction and turn lower to complete the 4y cycle low. At intermediate term high now topping process.
P.S. - for a trade both analysis and trigger should point in the same direction.


TECHNICAL PICTURE and ELLIOTT WAVES
Short term - we have two legs with 1,618 ratio. So either Z zig-zag is completed or impulse is running and currently in iv/5.


Intermediate term - two zig-zags down and up with the same size... waiting for B-wave to be completed and C-wave for a flat should follow.
Alternate wave 4 of ED expected.


Long term - 4y cycle high the end of 2021, now a-b-c lower into 4y cycle low in Q1 2024.
Very long term - most likely huge double zig-zag from the 2009 low was completed. Alternate if we are lucky this is some topping pattern triangle or ED and there is one more high in 2025.


MARKET BREADTH INDICATORS
Market Breadth Indicators - does not react to this rally at all... completely different behaviour compared to the firts leg.
McClellan Oscillator - around zero.
McClellan Summation Index - sell signal.
Weekly Stochastic of the Summation Index - sell signal.
Bullish Percentage - around overbought level with divergence.
Percent of Stocks above MA50 - around overbought level with divergence.
Advance-Decline Issues - in the middle of the range and divergence.
Fear Indicator VIX - up and down.


HURST CYCLES
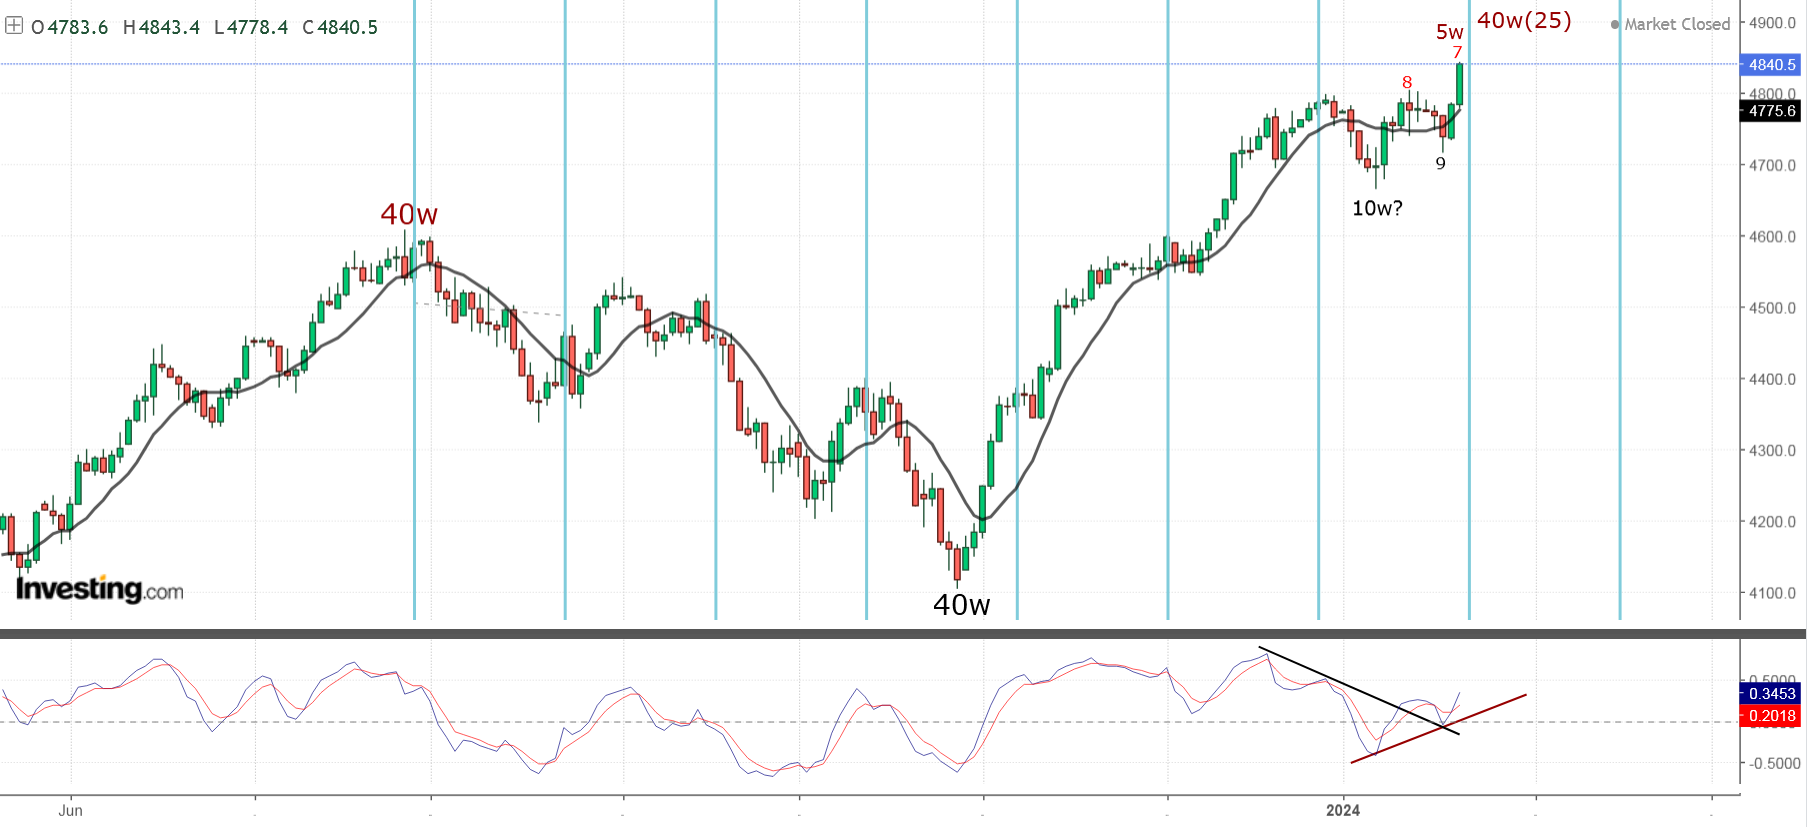
Short term cycles - 20d high and now pullback into 20d low. Probably one more 20d cycle for 8x5w cycles and 40w high.


Week 13 for 40w cycle. I expect 40w cycle low around June consisting of three extended 10w cycles.
Week 26, one more 20d cycle high and top of at least 40w magnitude... and very likely 18m high too.

Jan 20, 2024

Weekly preview

Short term - choppy move since mid-December, it looks like correction and a third zig-zag.
Intermediate term - the indices diverge NYSE/DJ have 10w low this week SPX maybe earlier... it is again the few tech stocks making it look strong. Possible 40w high after 25 weeks as the previous two cycles alternate one more 5w cycle.
Long term - this is at least 40w high(6 months long already) I think it is 18m high so after the top we should see decline into at least 40w low into June/July.
Very long term - one way to count is 7y cycle 2002->2009->2016->2022->2029 it fits with ED pattern and higher low in June/July. The other option is stick to the theory 9y cycle 2002->2011->2020->2029 with 54 month(4y) cycle low right on schedule mid-2024 - which fits with flat pattern and testing the low from 2022. The second option has better pattern alignment - important cycle lows/highs are at pattern lows/highs as it should be, the first one has 7y low at a subwave... very odd.

Overall picture - market breadth negative it could move up for divergence, RSI/MACD divergence daily and weekly, mature cycle, pattern five legs of what ever it is, magnificent 7 very toppy all with weekly divergences 5 wave impulses completing and half of them 5 of 5 wedge/ED.
Short said good luck holding longs... maybe this time is different and 20 points higher are worth it.


TRADING
Trading trigger - buy signal. Crossing up and down the MA no clear or extended 10w cycles... not easy to follow the count.
Analysis - final wave completing the correction and turn lower to complete the 4y cycle low. At intermediate term high now topping process.
P.S. - for a trade both analysis and trigger should point in the same direction.


TECHNICAL PICTURE and ELLIOTT WAVES
Short term - the suposed fifth wave broke the channel this impulse is bullshit, third zig-zag z-wave for tripple complex pattern looks way better.


Intermediate term - two zig-zags down and up with the same size... waiting for B-wave to be completed and C-wave for a flat should follow.
Alternate wave 4 of ED expected.


Long term - 4y cycle high the end of 2021, now a-b-c lower into 4y cycle low in Q1 2024.
Very long term - most likely huge double zig-zag from the 2009 low was completed. Alternate if we are lucky this is some topping pattern triangle or ED and there is one more high in 2025.


MARKET BREADTH INDICATORS
Market Breadth Indicators - pointing lower, some ticked up... maybe divergence will develop.
McClellan Oscillator - oversold and turned higher.
McClellan Summation Index - sell signal.
Weekly Stochastic of the Summation Index - sell signal.
Bullish Percentage - ticked up.
Percent of Stocks above MA50 - ticked up.
Advance-Decline Issues - ticked up.
Fear Indicator VIX - another higher low.


HURST CYCLES
Short term cycles - 20d low and now higher into 20d and 5w high. Other indices made their 10w low this week, the SPX seems made it earlier.


Week 12 for 40w cycle. I expect 40w cycle low in June/July consisting of three extended 10w cycles.
Week 25 this could be the top as with the previous two cycles alternate one more 5w cycle. This top is of at least 40w magnitude and very likely 18m high too.

Jan 13, 2024

Weekly preview

Higher as expected now we should see something lower for a few days. Short term looks clear - 20d high and now in the middle of 20d low. Intermediate term this is 18m/80w high currently week 74 from the last significant high - the cycle looks like 3x25 week long cycles and the last of this three cycles consisting of 5x5w cycles.


TRADING
Trading trigger - buy signal.
Analysis - final wave completing the correction and turn lower to complete the 4y cycle low. At intermediate term high now topping process.
P.S. - for a trade both analysis and trigger should point in the same direction.


TECHNICAL PICTURE and ELLIOTT WAVES
Short term - some count this as an impulse... this waves 2 and 3 are too ugly for me and 4 breaking the channel... I would rather count tripple zig-zag.
If you looking for impulse NYSE looks more like impulse.
I will not be surprised to see decline and the next trend line broken... may be we have not seen the 10w low.


Intermediate term - two zig-zags down and up with the same size... next should be decline probably C-wave for a flat.


Long term - 4y cycle high the end of 2021, now a-b-c lower into 4y cycle low in Q1 2024.
Very long term - most likely huge double zig-zag from the 2009 low.If we are lucky this is some topping pattern triangle or ED and there is one more high. If not multi year decline has started.


MARKET BREADTH INDICATORS
Market Breadth Indicators - ready for divergence when we see the price making higher high.
McClellan Oscillator - below zero.
McClellan Summation Index - sell signal.
Weekly Stochastic of the Summation Index - sell signal.
Bullish Percentage - pointing lower.
Percent of Stocks above MA50 - pointing lower.
Advance-Decline Issues - moving lower.
Fear Indicator VIX - higher lows.


HURST CYCLES
Short term cycles - 20d high now lower for a few days into 20d low. It looks like 5x5w cycle highs to me for 3x25 week long cycles.


Week 11 for the 20w cycle. The last low should be of 40w magnitude and this high is of 18m magnitude consisting of 3x20w extended cycles instead of 2x40w.
Long term the previous 4y cycle high is repeating - two years for mid-cycle high(2018-2019 / 2022-2023) and down into 4y low.

Jan 8, 2024

Weekly preview

Turn lower as expected. The weekly candle closed below the open from the last two weekly candles so with high probability we have reversal into 20w low. On the other side we should see 10w low so not sure how the topping process will play out.


TRADING
Trading trigger - sell signal.
Analysis - final wave completing the correction and turn lower to complete the 4y cycle low. At intermediate term high now topping process.
P.S. - for a trade both analysis and trigger should point in the same direction.


TECHNICAL PICTURE and ELLIOTT WAVES
Short term - wave lower and now we should see turn higher, but it is not confirmed at the moment.


Intermediate term - two zig-zags down and up with the same size... next should be decline probably C-wave for a flat.


Long term - 4y cycle high the end of 2021, now a-b-c lower into 4y cycle low in Q1 2024.
Very long term - most likely huge double zig-zag from the 2009 low.If we are lucky this is some topping pattern triangle or ED and there is one more high. If not multi year decline has started.


MARKET BREADTH INDICATORS
Market Breadth Indicators - turned lower.
McClellan Oscillator - below zero.
McClellan Summation Index - turning lower.
Weekly Stochastic of the Summation Index - turning lower.
Bullish Percentage - turned lower.
Percent of Stocks above MA50 - turned lower.
Advance-Decline Issues - in the middle of the range.
Fear Indicator VIX - short term higher lows.


HURST CYCLES
Short term cycles - at 20d low next is higher for 20d high.... probably 10w low too.


Week 10 for the 20w cycle. This should be 20w cycle high and turn lower into 20w low.
Long term the previous 4y cycle high is repeating - 3x40w cycles/two years for mid-cycle high(2018-2019 / 2022-2023) and down into 4y low.
From the October.2022 low the cycles do not follow the theoretical model.
The highs - we have one 40w high and one 18m high consisting of 3x20w extended cycles instead of 2x40w, but the same average length 15-16 months.
The lows - we have 20w and 40w cycle, I guess one more 20w cycle(the current one) to complete 18m/4y cycle.