Trading trigger - buy signal. Crossing up and down the MA no clear or extended 10w cycles... not easy to follow the count.
Analysis - final wave completing the correction and turn lower to complete the 4y cycle low. At intermediate term high now topping process.
P.S. - for a trade both analysis and trigger should point in the same direction.

TECHNICAL PICTURE and ELLIOTT WAVES
Short term - the suposed fifth wave broke the channel this impulse is bullshit, third zig-zag z-wave for tripple complex pattern looks way better.

Intermediate term - two zig-zags down and up with the same size... waiting for B-wave to be completed and C-wave for a flat should follow. Alternate wave 4 of ED expected.

Long term - 4y cycle high the end of 2021, now a-b-c lower into 4y cycle low in Q1 2024. Very long term - most likely huge double zig-zag from the 2009 low was completed. Alternate if we are lucky this is some topping pattern triangle or ED and there is one more high in 2025.

MARKET BREADTH INDICATORS
Market Breadth Indicators - pointing lower, some ticked up... maybe divergence will develop.
McClellan Oscillator - oversold and turned higher.
McClellan Summation Index - sell signal.
Weekly Stochastic of the Summation Index - sell signal.
Bullish Percentage - ticked up.
Percent of Stocks above MA50 - ticked up.
Advance-Decline Issues - ticked up.
Fear Indicator VIX - another higher low.
HURST CYCLES
Short term cycles - 20d low and now higher into 20d and 5w high. Other indices made their 10w low this week, the SPX seems made it earlier.
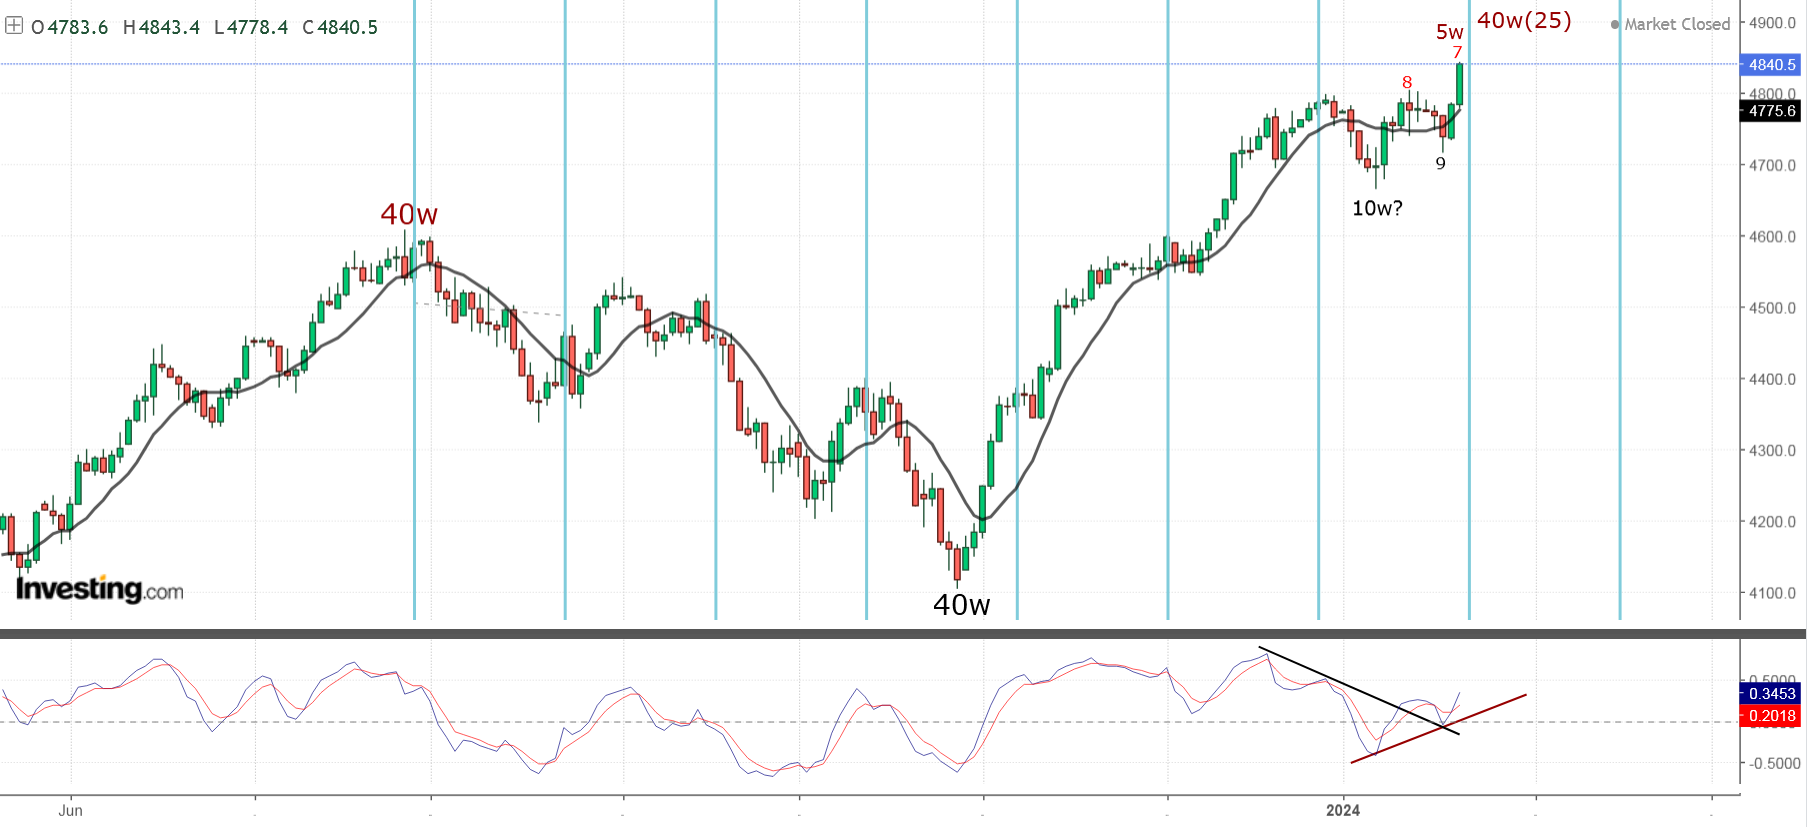
Week 12 for 40w cycle. I expect 40w cycle low in June/July consisting of three extended 10w cycles.
Week 25 this could be the top as with the previous two cycles alternate one more 5w cycle. This top is of at least 40w magnitude and very likely 18m high too.

Complicate but very nice work
ReplyDeleteNothing complicated - corrective zig-zag either B flat or 4 ED, decline for 5 months.
Deleteupper trendline stretch to 5023, does your corrective or 4 ED see this trend line?
DeleteI do not know which trend this is....
DeleteOne interesting with a lot of touches - https://invst.ly/132suj
Krasi, SPX futures exceed 4850, does your count still holds?
DeleteIt does not matter if it is 4800 4850 or 4900.
Deleteyes, Margin pressure.
DeleteThanks a lot
ReplyDeleteTime for short everything
ReplyDeleteTaking profits is a good first step.
DeleteKrasi, do you see 4900 traded next week?
DeleteAt the moment we have a=c it could go to a=1.618xc or not I can not say.... 1.618 extension is 4900 by the way.
DeleteHello, can you share with us what will be the lowest and highest level of SPX 500 this year ? Many thanks and congratulations for your work
ReplyDeleteHighest point for the year this high and lowest point in June/July how low depend on the pattern - see the weekly chart.
DeleteRSP bearish divergence with respect to SPX ...
ReplyDeleteIt is normal SPX looks strong because of a few heavy weight tech companies more than a quarter.
DeleteVery interesting, in your recommend you tube they are talking about May
ReplyDeleteLook VALUG, it is around 600 every time it has been there it has been the top
ReplyDeleteis this a wave4 pullback or the top is in...toss a coin. in any case we are very close to begin the decline. today or tomorrow..
ReplyDeleteJP
so is this a top now? its totally not moving after last friday crazy move.
Deletefirst short term low should be wednesday close / thursday open, then will see what kind of bounce we get from there. the decline should accelerate today/tomorrow, bonds not supporting this squeeze in equities we had.
DeleteJP
however so far the decline looks like a corrective consolidation unless it accelerates down and soon.. stop loss is obvious
DeleteJP
very strong action. i think we have the potential for another 80-100 point blowoff next few days.
DeleteJP
Several exhaustion gaps, fifth wave after extended third wave, RSI/MACD divergence this is not very likely scenario - https://invst.ly/134b5w
DeleteThe third wave was 100 points blow off now is the top with divergence.
thank you krasi. i hear you about the negative divergences and the w5 structure, but this may not be a w5 but a wC and the consolidation we had the last couple of days was wB. over the next 6 tds we have gdp, pce, fomc and a bunch of earnings. on top of it we have a full moon on thursday jan 25, which although i never follow astrology or understand how it works, i noticed that these full moons more often than not mark a turning point within 2 tds. i guess they are self fulfilling as many traders follow this stuff.
Deletei think we will have an important turning point before the genius speaks next wednesday. with all the data and figures coming in we will either decline into it or rally into it, in which case fomc will disappoint. i have a wall resistance at 4950spx (4980es) which may be tested if we keep on blowing fumes. i think any break of yesterday's lows from here will confirm the top is in. we'll see..
JP
It can not be B too small compared to the previous one . It could be iv/3 now higher v/3 then pullback 4 we are at day 10 for the 20d high. It is more likely to see pullback and one more high.
DeleteWe have the exhaustion gaps in the third wave already.
thank you it makes sense. one thing for sure we are in lala land here.. let's see
DeleteJP
Several gaps in a row - the same at the beginning in November. This time this are exhaustion gaps the final move.
DeleteI think we have one or 2 weeks, if stive write
ReplyDeleteThe sam like david
ReplyDeleteToday 4884
ReplyDeleteS&P to 5000, NDX to 18000?
ReplyDeleteThat give the target of the ED?
ReplyDeleteThe market will go down just before the fed cut ret
ReplyDeleteVix is positive today. Noone cares about the vixen anymore :(
ReplyDeleteNow we have two legs and 1,618 ratio. If it is Z this is is the top if we have impulse this is iii/5.
ReplyDeleteNDX looks like clear double zig-zag from the October low so skeptical about impulse.
krasi if this is the beginning of w4, do you expect it to bottom around spx 4830-40 before resumption of final w5 ? thanks
DeleteJP
krasi, are we there yet? 4900 with +vix?
DeleteThe same concept zig-zags(w-x-y) or impulses(a-b-c) shown on NDX - https://invst.ly/134xxz
DeleteTop or pullback FOMC and final high.
thanks for the NDC chart. can we see the SPX chart?
DeleteVix shows well the last 5w high-low, yesterday was 20d low?
ReplyDeleteThe same like december january
it looks like a w4 correction that should be completed by today/tomorrow followed by one more (last?) squeeze early next week.
ReplyDeleteJP
again very strong action!! we even had a truncated wave c for this small correction. this blowoff may surprise on the upside over the next few days. shorts careful..
DeleteJP
It is time for pullback not blow off
DeleteWhat magnitude of the expected pullback do you currently see? Thx
Deleteso far the rally looks weak and ndx looks like crap.. maybe we are close to finally turn down as krasi is suggesting. today is the full moon, a potential turning time for whatever it's worth.. maybe after fck u friday.
DeleteJP
Semis may have finished first.
ReplyDelete