Nov 30, 2019

Weekly preview

We have the final wave for the leg higher from the October low, now we should see the indexes decline at least to MA50 on the daily chart. We still need confirmation on Monday for reversal, but looking crude oil and the pattern for RUT it is more likely that the rally from October is finished.
My opinion is clear this is the high of wave B of a big correction which begun in Jan.2018 and it will be completed with one more leg lower around mid-2020.


TECHNICAL PICTURE and ELLIOTT WAVES
Short term - no matter how you count - impulse,impulse with extended fifth wave or a-b-c all this patterns are complete now and we should see decline starting next week. Confirmation is break of the trend line and move below 3090.


Intermediate term - one more touch of the trend line like July, MACD adding short term divergence to the multiple intermediate term divergences, RSI testing the broken trend line.
Next we should see decline to MA50 or MA200 to test one of the support levels. This wave lower with its size and shape will give us more information what is going on.


Long term - at the top of wave B. Expect sell off to begin and to continue into Q2.2020 to complete the correction which begun in January 2018. Alternate scenario a decline in three waves, but still a decline.


MARKET BREADTH INDICATORS
Market Breadth Indicators - the same weak with multiple divergences.
McClellan Oscillator - above zero with multiple divergences.
McClellan Summation Index - sell signal with multiple divergences.
Weekly Stochastic of the Summation Index - sell signal.
Bullish Percentage - at the overbought level with multiple divergences.
Percent of Stocks above MA50 - at the overbought level with multiple divergences.
Fear Indicator VIX - expect sharp rise higher after building base for a while.
Advance-Decline Issues - in the middle of the range with multiple divergences.


HURST CYCLES
Day 6 for the second daily cycle.


Week 14 for the 20 week cycle.

Nov 23, 2019

Weekly preview

Lower but we do not have an impulse yet to confirm reversal. I think reversal fits better, but until we see confirmation we have to assume that one more high is possible.... maybe something like the July high - one more touch of the trend line(see the daily chart).
The big picture is the same - I expect important high wave c/B to be completed and the final wave lower in to mid-2020 to finish the correction.

Disclaimer: all this below are just fancy looking colorful pictures for fun:) Do not trade based on them. Do not blame me for your trades.


TECHNICAL PICTURE and ELLIOTT WAVES
Short term - if you think this is an "impulse" w4 is now running with one more high for w5. The price action the last three days is very choppy and overlapping and I do not see how this is a turn up again, more likely another move lower. As long as the price stays in the channel it is possible that this is c/4, but if the channel is broken we have reversal.
My feeling tells me this is not the right pattern. This count does not fit well with DJ and NDX and the message from RSI(see DJ below). This second part of the rally looks bigger and stronger creating the illusion for a third wave, when in fact it just takes longer and has the same size.

For DJ counting an impulse does not work so good - this is classical a-b-c pattern with "a" as a zig-zag, "c" as an impulse and a=c... or some are counting fifth extended wave(yellow). For this counts one more high does not look so good because you need small wave iv of c or 5 an it takes already too long. RSI says the movfe from the October low is finished we have broken trend line which is tested now.


Intermediate term - RSI hit overbought level and broke the trend line so either we have a top or one more touch of the trend line with divergences like in July. There is no more third waves or extensions what ever. We have three consecutive higher highs and MACD with lower highs multiple divergence, I do not see how this is not a top.
I explained above that this is probably corrective leg so in this case you can count expanding ED for c/B... better visible on the futures. This pattern is extremely seldom, I call it unicorn:) I have never seen one maybe this is the first time.


Long term - we are nearing the top of wave B and sell off into Q2.2020 should complete the correction which begun in January 2018. Alternate scenario a decline in three waves, but still a decline.


MARKET BREADTH INDICATORS
Market Breadth Indicators - weak and turned lower again.
McClellan Oscillator - below zero.
McClellan Summation Index - sell signal with divergences.
Weekly Stochastic of the Summation Index - sell signal with divergences.
Bullish Percentage - turned lower with divergences.
Percent of Stocks above MA50 - turned lower with divergences.
Fear Indicator VIX - building a base, spike higher expected.
Advance-Decline Issues - heading lower no signs of strength.


HURST CYCLES
Day 63, RSI and price broke the trend line and RSI broke below MA18 signaling daily cycle turning lower.


Week 13 for the 20 week cycle.

Nov 16, 2019

Weekly preview

Now we have the last two missing waves and the move from the October low looks complete. Next we should see move lower. The odds are high that this is the top for the rally from Dec.2018... I see so many indexes and shares with completed patterns. Confirmation will be an impulse lower at least to MA50

Some explanation - even with reversal the indexes will not plunge 200 points next week. There will be several entry points. First the indexes are well above MA50 and MA200 which means after the first leg lower i/1/C expect higher in December for ii/1/C. Second after the first wave lower is finished there will be a big bounce at least 2/3 for wave 2/C.
Wait for confirmation - ii/1/C or 2/C. The most profitable trade will be next year 3/C or c/Y what ever. This way you will not be caught on the wrong side.


Disclaimer: all this below are just fancy looking colorful pictures for fun:) Do not trade based on them. Do not blame me for your trades.


TECHNICAL PICTURE and ELLIOTT WAVES
Short term - wave 4 played out as a sideway move triangle lasting whole week followed by final burst higher. There is enough waves to count impulse for w5. Now waiting to see what happens next week. Brake below the trend line will confirm that the move from the October low is finished.


Intermediate term - the main scenario is important high w-x-y/B. The only way to extend the move higher is ED for c/B. This is the alternate scenario if we see only a zig-zag lower. In both cases next the indexes should test MA50 at least.
Impulse will mean reversal zig-zag more to he upside.


Long term - we are nearing the top of wave B and sell off into Q2.2020 should complete the correction which begun in January 2018. Alternate scenario a decline in three waves, but still a decline.
MACD and RSI - multiple divergences, third higher high with the indicators showing lower high.... smells like a top.


MARKET BREADTH INDICATORS
Market Breadth Indicators - the same... weak with multiple divergences.
McClellan Oscillator - below zero with multiple divergences despite the indexes "flying" higher.
McClellan Summation Index - multiple divergences, turned lower and sell signal.
Weekly Stochastic of the Summation Index - buy signal.
Bullish Percentage - scratching the overbought level with multiple divergences.
Percent of Stocks above MA50 - scratching the overbought level with multiple divergences.
Fear Indicator VIX - bottoming, next we should see spike higher.
Advance-Decline Issues - weak in the middle of the range.


HURST CYCLES
Day 58, something lower expected.


Week 12 for the 20 week cycle. After a 40w cycle low I was expecting 3 months higher - now we have this three months. We should see a top soon.


Tom Demark SEQUENTIAL AND COUNTDOWN - this technique spots areas of exhaustion.
Right on time for a high we have completed countdown. Early signal for reversal is price flip or close below 3080 at the moment.

Nov 9, 2019

Weekly preview

Now we know with very high probability that 40w low and b/B are behind us and the final wave from B is running.

What I see is a zig-zag higher from the August low... it does not really fit like 1-2-3. In this case we have w-x-y for B, alternate we have b/B early October and now c/B running. Looking other indexes DAX or NIKKEI for example and some shares the pattern is more likely w-x-y.
The bulls will disagree:) the bullish cases - 1-2 i-ii market breadth with multiple divergences and extreme sentiment does not support this case, w1 big triangle and now i/3... such shallow triangles are wave b not 2 and there is no triangle in the first place.


TECHNICAL PICTURE and ELLIOTT WAVES
Short term - I think we have zig-zag from the August low for y/B. For wave c ideally we should see a few days lower for 4 and another high to finish c/y/B.


Intermediate term - the two options which I have explained w-x-y/B or a-b-c/B, it is the same at the end.
A lot of divergences so I discard bullish patterns - we have three higher highs in a row and for each one MACD/RSI are making lower high. This is not bullish break out, this is a top around the corner.
By the way time looks interesting too - w/x/y from B have similar length 3-4 months each so balanced pattern. Even more interesting A/B have exactly the same length around the end of November.


Long term - the big picture is not changed, we are nearing the top of wave B and sell off into Q2.2020 should complete the correction which begun in January 2018.
I do not see how the price will go vertical to erase the divergences. The sentiment is already at extreme which you see short before the top and not at the beginning.


MARKET BREADTH INDICATORS
Market Breadth Indicators - nothing new weak with divergences, some turned lower, and extreme bullish sentiment Fear&Greed index at 91.
McClellan Oscillator - with divergences and below zero despite the indexes showing "strength".
McClellan Summation Index - buy signal with multiple divergences.
Weekly Stochastic of the Summation Index - buy signal.
Bullish Percentage - trying to touch the overbought level, multiple divergences.
Percent of Stocks above MA50 - turned lower with divergences.
Fear Indicator VIX - staying between 12-13, probably we will see spike higher and higher low.
Advance-Decline Issues - pointing lower, no signs of strength.


HURST CYCLES
The charts adjusted for 40w low in August. It is questionable, but in October my indicators tell me this is one big nothing and indexes like DAX/NIKK with clear low in August so I have chosen August for 40w low. I explained once 35w is average length so it is ok. Do not try to find symmetry - most of the time you will be disappointed. It does not work this way probably that is why many think that cycles does not work:)

Day 53, decline for a few days should finish this daily cycle(80d or 10w Hurst cycle) and 2-3 weeks higher from the next 10w cycle before bigger sell off.


Week 11 for the 20 week cycle.

Nov 2, 2019

Weekly preview

Final waves 4 and 5 were missing and this week not only SP500 all indexes were busy completing the pattern even DJI despite the weakness made a high above the September high for valid a-b-c from the August low. Only RUT is lagging a little bit, but no problem to complete the pattern on Monday.
Now we have enough waves for complete pattern, indicators with divergences, weak market breadth and extreme greed so I expect reversal next week.

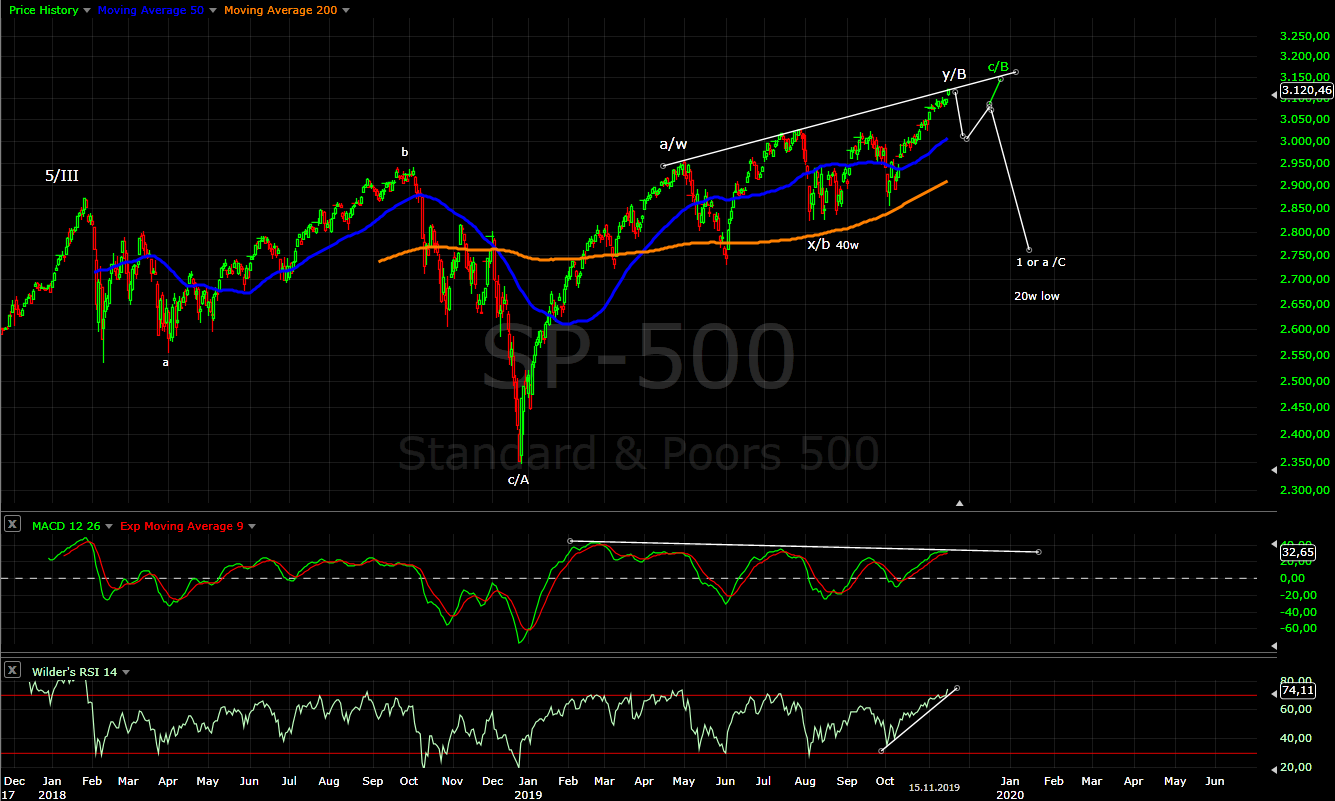
The big picture - no change I expect to see sell off to around 2780 to finish b/B.


TECHNICAL PICTURE and ELLIOTT WAVES
Short term - from August I see two legs higher with the same size so this is a-b-c for me.
If we have w4 this week the final w5 could extend another day or two next week. This count would be similar to RUT or XLF with normal size w3=1,618x1, on the other side NDX and DJI have too big declines in middle and in this case this should be the final v/5 - difficult to say which one.
MACD and RSI with divergences confirming that the fifth wave is running.


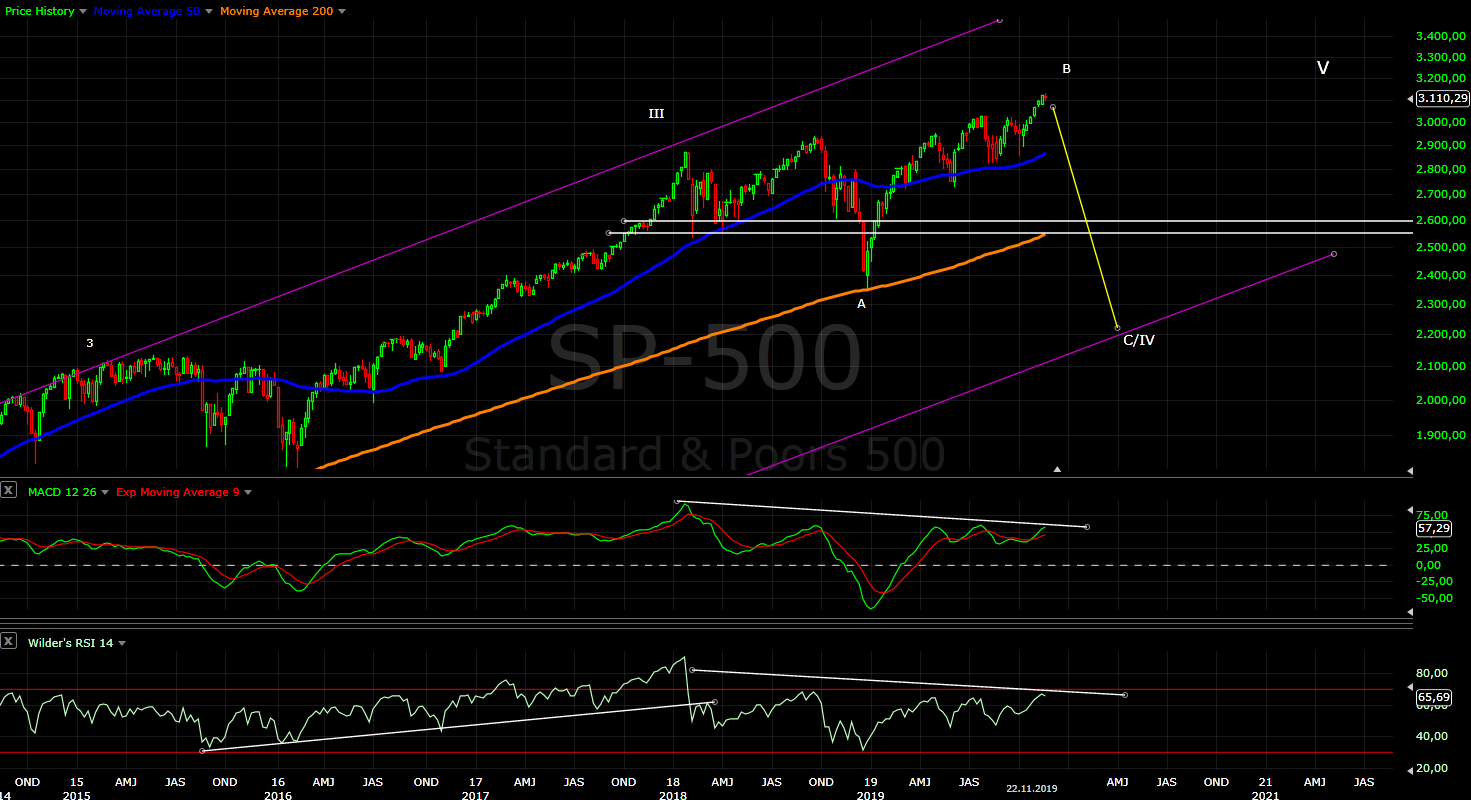
Intermediate term - I see completed a-b-c higher with divergences so next we should see move lower. The same pattern which I follow for weeks - corrective b wave and sell off to finish b/B .


Long term - at the moment I expect a correction to be finished in November. Then a rally for 3 months followed by final sell off to finish the correction which begun in 2018. There is too many alternate scenarios I will think about them if we did not see a sell off in November.


MARKET BREADTH INDICATORS
Market Breadth Indicators - are pointing higher, but showing weakness and divergences. Fear&Greed index showing extreme greed. The overall look is like for intermediate term high.
McClellan Oscillator - very weak with short term and intermediate term divergences.
McClellan Summation Index - buy signal, but with divergence.
Weekly Stochastic of the Summation Index - buy signal.
Bullish Percentage - pointing higher, but multiple divergences not confirming new ATH.
Percent of Stocks above MA50 - pointing higher, but multiple divergences not confirming new ATH.
Fear Indicator VIX - the impulse lower to around 12 to touch the trend line was completed, now we should see spike higher.
Advance-Decline Issues - weak, could not reach overbought reading, divergences - not confirming new ATH.


HURST CYCLES
The next few weeks should show at last where to place the important low. For 40 week cycle low we should see strong sell off lasting 2-3 weeks below the August lows.

Day 55 turn lower is overdue.


Week 22 expect sharp sell off for 2-3 weeks. If we have 40 week cycle low the price should move below the August lows. For 40 week cycle low in August and daily cycle low/10 week cycle low the price should stay above the August lows.


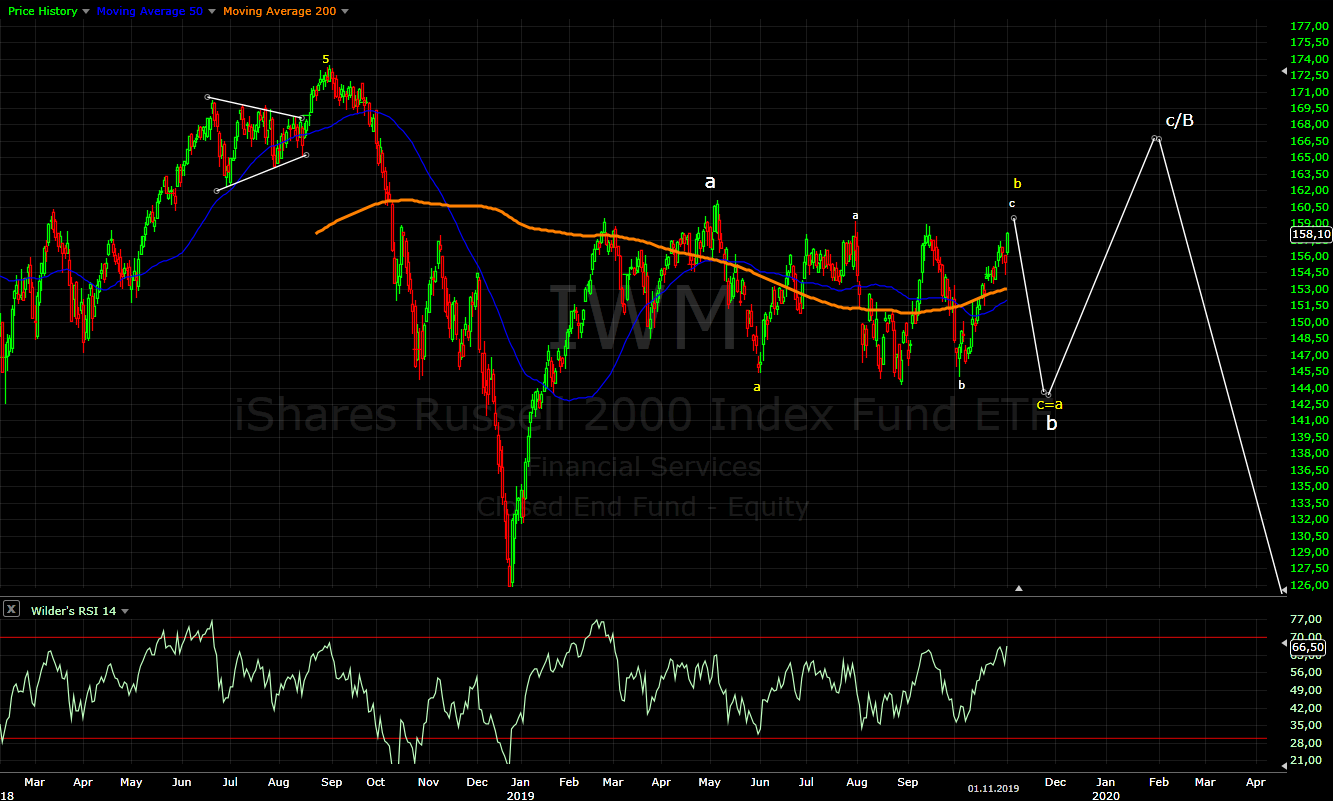
To continue from last week with another two indexes with different pattern, but sending the same message - the most likely scenario is sell off for b/B. Very choppy declines for RUT and DJT, difficult to imagine that this is reversal. The w-x-y top theory does not work either.

IWM(RUT) one more push next week for a high above the September high will look perfect.


DJT already reversed with impulse lower and bouncing from MA50.