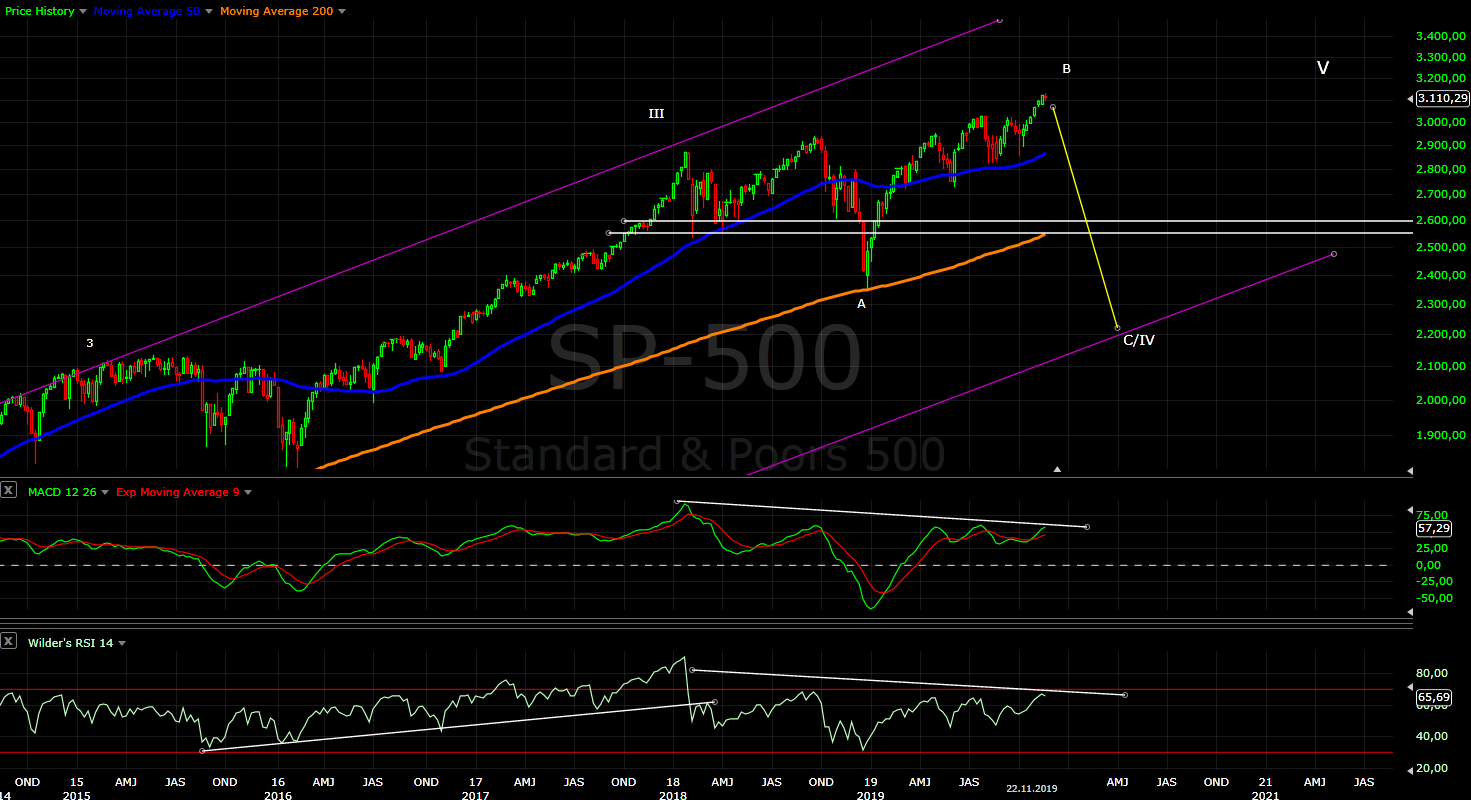
The big picture is the same - I expect important high wave c/B to be completed and the final wave lower in to mid-2020 to finish the correction. Disclaimer: all this below are just fancy looking colorful pictures for fun:) Do not trade based on them. Do not blame me for your trades. TECHNICAL PICTURE and ELLIOTT WAVES
Short term - if you think this is an "impulse" w4 is now running with one more high for w5. The price action the last three days is very choppy and overlapping and I do not see how this is a turn up again, more likely another move lower. As long as the price stays in the channel it is possible that this is c/4, but if the channel is broken we have reversal.
My feeling tells me this is not the right pattern. This count does not fit well with DJ and NDX and the message from RSI(see DJ below). This second part of the rally looks bigger and stronger creating the illusion for a third wave, when in fact it just takes longer and has the same size.

For DJ counting an impulse does not work so good - this is classical a-b-c pattern with "a" as a zig-zag, "c" as an impulse and a=c... or some are counting fifth extended wave(yellow). For this counts one more high does not look so good because you need small wave iv of c or 5 an it takes already too long. RSI says the movfe from the October low is finished we have broken trend line which is tested now.

Intermediate term - RSI hit overbought level and broke the trend line so either we have a top or one more touch of the trend line with divergences like in July. There is no more third waves or extensions what ever. We have three consecutive higher highs and MACD with lower highs multiple divergence, I do not see how this is not a top.
I explained above that this is probably corrective leg so in this case you can count expanding ED for c/B... better visible on the futures. This pattern is extremely seldom, I call it unicorn:) I have never seen one maybe this is the first time.

Long term - we are nearing the top of wave B and sell off into Q2.2020 should complete the correction which begun in January 2018. Alternate scenario a decline in three waves, but still a decline.
MARKET BREADTH INDICATORS
Market Breadth Indicators - weak and turned lower again.
McClellan Oscillator - below zero.
McClellan Summation Index - sell signal with divergences.
Weekly Stochastic of the Summation Index - sell signal with divergences.
Bullish Percentage - turned lower with divergences.
Percent of Stocks above MA50 - turned lower with divergences.
Fear Indicator VIX - building a base, spike higher expected.
Advance-Decline Issues - heading lower no signs of strength.
HURST CYCLES
Day 63, RSI and price broke the trend line and RSI broke below MA18 signaling daily cycle turning lower.

Week 13 for the 20 week cycle.

Fair to say a new high coming?
ReplyDeleteYes, one more test of the trend line, RUT catching up with the final wave higher. Overall no change - topping.
Deletewave 3 of ED in sp?
DeleteI was thinking about ED, in this case it is 1 of ED. RSI does not confirm that we are in the middle of ED.
DeleteI would say more likely normal impulse, but it looks smaller because it is not 5 from the Cctober low rather v/c.
Another sign of top, Cramer is back saying market is cheap due to M&A ... history says record cash gets deployed in unsuccessful mega mergers usually during market tops...
ReplyDeleteIt's all getting very exciting.
Keep up the good work Krasi.
When are you guys gonna stop trying to call the top? Totally wrong all year. From the Jan 27, 2019 report the long term chart had B not even touching 2900 before 2200. https://4.bp.blogspot.com/-D9NlzRjU1oY/XEwZkIgX3nI/AAAAAAAAIwU/MHfKMsg0f7EZIBMxg0Y845ePidsXO9RSgCLcBGAs/s1600/w380-3.PNG Little off don't you think? Seriously, why fight a market that has shown it wants to go up all year? You guys missed out on one of the most profitable years in history. Sure it might go down one day but you missed a great financial opportunity. Your not making money with EW. When Mr. Market finally wants to go down are you guys gonna fight it the whole way calling a bottom??? I don't get it. When it's going up, ride it up. When it's going down, ride it down. Geez. Cue the original one liner, "Look it's a troll now I know the top is in".
ReplyDeleteOne of the most profitable years, market +25% he says.
DeleteWhat i see is market just recovering the 4Q18 selloff of 20%, back to this 3k/3100 area ...
Who says we missed out? 1H rally was sufficient to make this year very worthwhile without needing to chase the last bits. I played the rally using options, My account is +85% YTD I am happy to say thanks and sit it out.
Maybe you have the skill to get out of longs at exact top, I don't.
Like Krasi says, it gets noisy here close to tops and bottoms.
Total BS. People saying they made 100% or 200% trading options. Good for you. How much did you make on average after taxes and after countless losses? I am guessing you aren't written about on Wall Street Journal for your lasting trading brilliance. You know what? Past does not predict the future. No matter how much you stare at the charts, past does not predict the future. Wall Street has plenty of so called technical traders working on RSI, EW, etc etc. Completely worthless. Just buy the index and invest over long term. Forget this BS.
DeleteI am based in a location that does not have capital gains tax. So your analysis is wrong.
DeleteBelieve it or not, I have been written about in the press for my investing.
I never said I don't invest long term, that is in another account that had great entry in 2010.
But this is a trading forum specifically talking about technical signals, both ST and LT.
Anyway if you don't like the approach, feel free to ignore and stick with buying ETF. No need to complain.
Anonymous 1 - the next amateur with the fantasy misses.... at the same time showing my chart with forecast 21% higher?!?!?!?
DeleteI am curious how all come to the conclusion that predicting a high means missed the last 11 months? I do not see the connection at all.
Why 2870 - simple 90% retracement the minimum for flat correction. Can I predict in advance it will be expanded flat and not a simple flat? No I can not. No one can predict the path of a corrective move one year in advance. There is no perfect tool including EW. At least at the low I was predicting move higher.... Where were you in December? Somewhere shitting your pants and crying.
Anonymous 3 - you are even a bigger joke, sorry but long term investors is just another word for a clueless trader or loser. The market made zero progress for two years and with the time needed for the final decline plus another retracement are 4 years. You really convinced me that you are smart,
when in fact you are just clueless or more polite said - "long term investor".
All this worthless tools RSI,EW made a lot of money down and up for those who know how to use them and how much did you made in the last two years? - one big zero.
One advice for you - all this long term investment is coming to end in the next 5 years and ugly market up and down for decades is coming. Start learning how to read the chart instead of explaining me completely worthless bullshit about long term investing.
"Where were you in December? Somewhere shitting your pants and crying."
DeleteNope I sold in Oct when the market showed it clearly wanted to go down. I was in all cash. In Jan I bought back in. Nice try. Only a dumb ass would have sold at the bottom. No reason to fight Newton's first law of motion. You guys make this too complicated. Anyway, good luck.
I think you guys need to stop this childish game of insulting and use your brain. I invest in low cost S&P 500 index where I contribute the same amount every month. As you describe, when the market drops, my contribution gets invested as the market drops. When the market goes back to prior highs, I have made substantial sum due to consistent placement. I also invest with 35 year horizon as I am in my 30's and I have no need for the money till retirement. I stay fully invested and I do not cry at the bottom as I know draw downs are always present no matter what strategy you use. I use time as my greatest asset in building wealth.
DeleteWhen you trade, you trade small as you say. So sure, you can make some but you will have to make so much more to actually have similiar return as someone always fully invested.
I am a Boglehead and if you think you can outperform me, show me. Show me how your overall trading has actually done better than monthly average cost investing over past ten years. Show me how your consistency actually resulted in consistent outperformance over someone who invests consistently over decades.
The reality is you guys suffer from remembering only your right guesses and forget all the missed opportunities as well as losses. Not to mention paying all the short term gain taxes.
Instead of saying how this cycle looks streteched and another cycle is now behind us etc etc, show me a consistent predictive method. Show me how you have outperformed S&P with your total assets and not just 10% being traded.
Also for your information, S&P 500 returns past 4 years INCLUDING dividends are as follows
Delete11.96%
21.83%
-4.48%
current year 20+%
So please get your facts straight about not making any money past 4 years.
I will repeat it again maybe the real long term investors those who want to listen will understand it:
DeleteFirst the correction begun Jan.2018 by the time it is over and fully retraced it will take roughly 3,5-4 years. Holding so long for no gains is not smart it is stupid. Holding and waiting two 20%-30% corrections is not smart it is stupid.(for the guy above wrong time period)
Second in five years a whole era 95 years from 1930-ties of buy and hold is coming to an end. Look at 2000-2009 the same but higher degree, take 1/3 of the time or three decades correction up and down with buy and hold not working.
To the other long term investor who thinks is very smart - you just got lucky to catch the best 10 years ever and extrapolate it... best means it will not repeat, you will be very disappointed with the next 30 years see point two. You think you are very smart seeing your investments multiplying and cocky now when in reality you do not have experience and you are totally unprepared for what is coming.
Of course you will not believe me, just wait and watch. After the final wave higher in several years, 30 years correction plus high inflation begins and by the end of your investment life(usually 40-45 years max) counting inflation with your strategy you will have less money than now.
You are really naive if you think that experienced trader can not make 10% per year, not to mention the first point where traders make money and you are just watching for several years. I trade only triple ETFs and need to catch only half of the move and I will make more money than just holding for ever.
Full with amateurs, the market made it easy and they think they are smart....
I agree with Krasi.
DeleteMarket is filled with ETF, SIP, passive investors who are extrapolating 2009-2019 market returns to perpetuity. Lucky if you started the systematic buying in 2009. If you had picked another point in time you could have had 10 year period of lacklustre returns.
Anyway this is another debate like active vs passive management. In these markets active managers underperform simply because buy and hold gets rewarded. It's not always so.
Btw Krasi, about 30 year correction and higher inflation... current market mindset is stocks are hedge against inflation too.
DeleteSo at moment no point explaining anything really. Markets feel 2007 like.
meh, i made 200% on call options the last few days
ReplyDeleteWith such low volatility, allow me not to believe you:)
DeleteOwn the wings young man, as my boss always said.. I am thankful to him (founder of a $20 billion hedge fund).
DeleteBut for those disbelievers options will never make sense, neither will leverage or asymmetric payoffs.
Look russell futures . I see ED now wave 5
ReplyDeleteThe futures look like in final fifth wave from the low last week - you can count impulse, RSI broke the trend line and with divergence on the hourly chart.
DeleteRUT is catching up this week with the final wave from the October low. Short term I can not see ED... the cash index RUT looks like w4 and today opening higher will finish w5 in sync with the the other indexes.
Nyad cumulative has made new highs. There is no divergence
ReplyDeleteWatch this only for the end of the bull market.
DeleteThe thing I like about you Krasi is you have a system in place. This allows you take emotions out of the game. I'm the same way. I'm not a fan of EW but I also have indicators which tell me when to get in and out of the market. I don't question them. I go with the flow.
ReplyDeleteIt took a lot of years, but now I keep emotions out of trading - I do not care if I am wrong or not, if the market moves higher or lower, profits or loses do not make me euphoric or sad. Following the market is all that matters.
DeleteI think there is big misunderstanding about my analysis that EW or some line drawn up or down means trade or reversal.
EW is just part of the puzzle - trying to find completed pattern for low risk trade. There is many other signs signaling short term or important low/high. The overall picture must look right and then comes the trigger. Now is such moment for example:) I will not change my mind because most do not like the message.
Most of the time is easy just following the trend. Currently is more complicated because we have corrective structure masked as strong move, of course only a few see it and believe it.
Krasi, I think we saw 5 waves complete just now
ReplyDeleteYes, now we have complete set of waves for an impulse from the low last week.
DeleteNow we can only wait and see what happens.
3153
ReplyDeleteThis is what I see at the moment impulse with perfect Fibo measurements - https://imgur.com/a/KAuOnhk
DeleteJust in time for the holidays ��
ReplyDeleteKrasi, I am seeing that market breadth is getting better this week
ReplyDeleteGetting better, but nothing different - the same old divergences.
Delete