I would say the B-wave(from the late September low) is dead - too steep and too big. The question is if
we have c/Z or a/c/Z. From pattern perspective it is almost perfect - equality reached c=a for Z, three zig-zags from the March low with roughly the same length. From cycle perspective another few weeks will look better, but this is not a guarantee(the last chart).Maybe we will see some topping for a few weeks and one more test of the trend line(daily chart)....
Market breadth is troubling for the bullish case. It behaves like we have transition from bull to bear market. In bull market the indicators touch oversold levels and shoot up in overbought territory and stay there. In Bear markets the opposite occurs.
Currently we have vertical move "400 pt rally in a month. Fastest bull market in history since the 2020 low"... cheering and what is market breadth doing? Not even touched overbought levels. Bullish Percentage is below 70, McClellan Summation Index is below 500, Percent of Stocks above MA50 is below 75, Advance-Decline Issues is not even close to overbought.
TRADING
Trading trigger - buy signal.
Analysis - sell the rips, time to get out, potential major top.
P.S. - for a trade both analysis and trigger should point in the same direction.
TECHNICAL PICTURE and ELLIOTT WAVES
Short term - it looks like impulse, but looking the DJ you can see another double zig-zag - https://invst.ly/wimw4. Waiting to see the reaction reversal or b-wave. (it is "or a/c/Z")
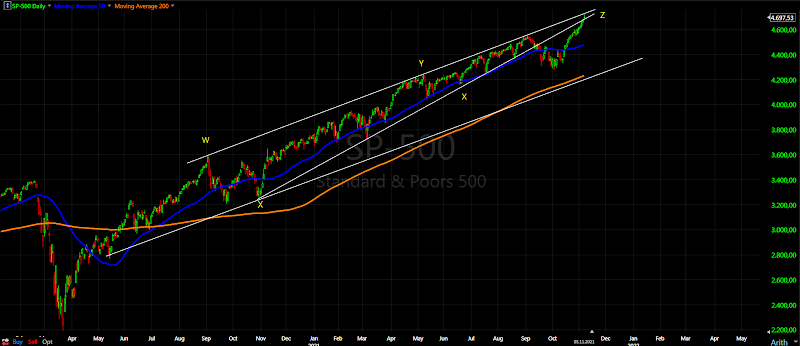
Intermediate term - I see three zig-zags with roughly the same length in time W-x-Y-x-Z from the March.2020 low.
Testing the trend lines and two legs higher with the same size for Z. Waiting to see the reaction.
Long term - topping process running for months and maturing. Some kind of corrective wave b-wave and c-wave will follow. MACD and RSI look very "bullish".
MARKET BREADTH INDICATORS
Market Breadth Indicators - no change signs of weakening, at least short term top.
McClellan Oscillator - lower highs and divergence.
McClellan Summation Index - buy signal.
Weekly Stochastic of the Summation Index - buy signal.
Bullish Percentage - below 70 like double top.
Percent of Stocks above MA50 - below 75.
Fear Indicator VIX - higher low so far... double bottoms short term and intermediate term.
Advance-Decline Issues - lower high and heading lower.
HURST CYCLES
Short term cycles - not easy to spot following the indicator below this is the short term count - 5w high followed by a 5w low and now at 20d high, next we should see a few days correction for a 20d low.
Week 5 for the 20w cycle. Long term I am expecting 4 year cycle high. The 18m low still not clear - either in June on time or late Septembar the case with one extra 20w cycle so that time adjust for the missing one from last year.
Last week wrote if it is not B-wave it is bearish because it is heading higher into the sixth 40w cycle high or 4y high. This is how it looks like - 4 perfect hits one a few weeks earlier and the current one. Perfect hit is in a few weeks. jpnor this is mid-December I can not twist it as a low....