Feb 24, 2018

Weekly preview

Short term view - not sure... one more leg lower for the pullback will look better.
Intermediate term view - the pattern is not clear, I think wave 4 is not over and B wave is running.

Choppy pullback this week as expected... which does not help us much, the pattern is still unclear. Most of the indexes with a-b-c, RUT and NDX with impulse..... more confusion. Short term the same store is the pullback over or not.
The perfect fake out will be to see sharp move lower for 2-3 days to finish b of B then reversal again for c of B , but shorter in time and price and reversal again for wave C triangle/zig-zag/flat.
I doubt 2 weeks will correct a rally for more than a year, it will be strange that is why the primary scenario is the indexes are still in wave 4.


TECHNICAL PICTURE and ELLIOTT WAVES
Short term - I see only a-b-c(red) higher. The pattern and the indicators do not look like a reversal so more likely b of B. Is it finished or not I do not know. Looking at RUT and for more confusion it will be nice to see another leg lower.

Here is how RUT(IWM chart) looks like. I see an impulse with perfect Fibo measurements. This pullback looks too short time and price....


Intermediate term - as I wrote 2 weeks look too short to correct 15 months. It is more likely that this is wave B. Possible patterns flat, zig-zag or triangle.


Long term - one more rally before the bull market is over.


MARKET BREADTH INDICATORS
Market Breadth Indicators - most of them look bullish and it is more likely that wave B is not finished.
McClellan Oscillator - above zero.
McClellan Summation Index - turned up, buy signal.
Weekly Stochastic of the Summation Index - sell signal, in the oversold area.
Bullish Percentage - buy signal, in the middle of the range.
Percent of Stocks above MA50 - buy signal, in the middle of the range.
Fear Indicator VIX - cooling off, fear fades out:)
Advance-Decline Issues - close to overbought level.


HURST CYCLES
Day 9 of the 40 day cycle.


Week 12+2 the low for wave 4 should be the low for this 20 week cycle.

Feb 17, 2018

Weekly preview

Short term view - pullback and one more high.
Intermediate term view - leg lower, more likely with higher low and higher again.

Higher to the MA50 daily this was obvious, the surprise is again the speed. We are in no man's land at the moment, at a point where different scenarios are possible. Until we see the next move lower no one can tell you for sure. This is wave 4, they are very notorious and the most difficult to predict. Usually you should not even think about trading. The difference this time is the swings are so huge it is tempting to trade them.
If this is wave 1 I do not like how fast and high it moves. The consensus is that we have wave c of B expanded flat and one more leg lower to finish the correction. I do not like it when everybody see the same. Why not "a of B" of a triangle?
I do not know.... is it B or 1 or something else, but I think we should see one more test of the low. I do not believe in V shape recovery.


TECHNICAL PICTURE and ELLIOTT WAVES
Short term - choppy move... it needs 4-5 4-5 to look like an impulse(green). If the indexes turn lower now the move will be just an a-b-c(red).


Intermediate term - I think we will see one more move lower. If it is 1-2(green) expect deep retracement 61,8% and test of the trend line around 2620. If it is B(red) wave C lower to around 2500. I will not be surprised if this is a of B from the triangle which I have shown previous week.


Long term - one more rally before the bull market is over.


MARKET BREADTH INDICATORS
Market Breadth Indicators - most turned up, but McClellan indicators are still bearish. I suspect at least a test of the low and higher low for the market breadth indicators.
McClellan Oscillator - moved above zero.
McClellan Summation Index - sell signal.
Weekly Stochastic of the Summation Index - sell signal, reached oversold level.
Bullish Percentage - turned up, buy signal.
Percent of Stocks above MA50 - turned up, buy signal.
Fear Indicator VIX - moving lower after hitting 50, this is normal such levels are short living.
Advance-Decline Issues - turned higher, I expect to see one more higher low.


HURST CYCLES
Day 5 of the next 40 day cycle.


Week 12+1 waiting to see if wave IV is finished or not.

Feb 10, 2018

Weekly preview

Short term view - choppy moves, but overall higher.
Intermediate term view - finished corrective move, probably testing the low one more time and higher.

It was obvious that there is more to the downside, but I can not predict flash crash and the speed of the move was really crazy. After the crash on Monday I thought the patterns are invalidated, but looking at the charts I saw that everything is fine. How can I predict A-B-C to MA200 / 0,382 retracement and reversal from the 2540-2560 area - no I do not know the futures, just the market follows the rules exactly to the letter. This is a good news the market is not running amok and we can continue following the chart analysis.

I see finished zig-zag at MA200 and 0,382 Fibo level. The European markets and SOX just finished impulse lower which was the final wave of an expanded flat for wave IV, EEM and XBI with clear zig-zag. All this seems to confirm that we do not have an impulse lower just a corrective move. The options are wave IV is finished and wave V has begun or this zig-zag is part of a bigger pattern most likely wave A of a triangle. Market breadth and the indicators are still pointing lower no reversal signal, there is a lot of fear so I think we should see a test of the low with a higher low before the indexes really start rallying. V shape move looks unlikely average Joe is scared:)

Interesting is we have panic and no flight to safety bonds and gold. The correlation has changed bonds and stocks get hurt by rising yields and sink together. It is possible that TLT is finishing wave B of a flat correction instead of a triangle. If this is the pattern and if the correlation really changed TLT and SPX will have exactly the same path until the summer.
P.S. some one asked about TLT targets in this case the target is higher around 117 not 115.


TECHNICAL PICTURE and ELLIOTT WAVES
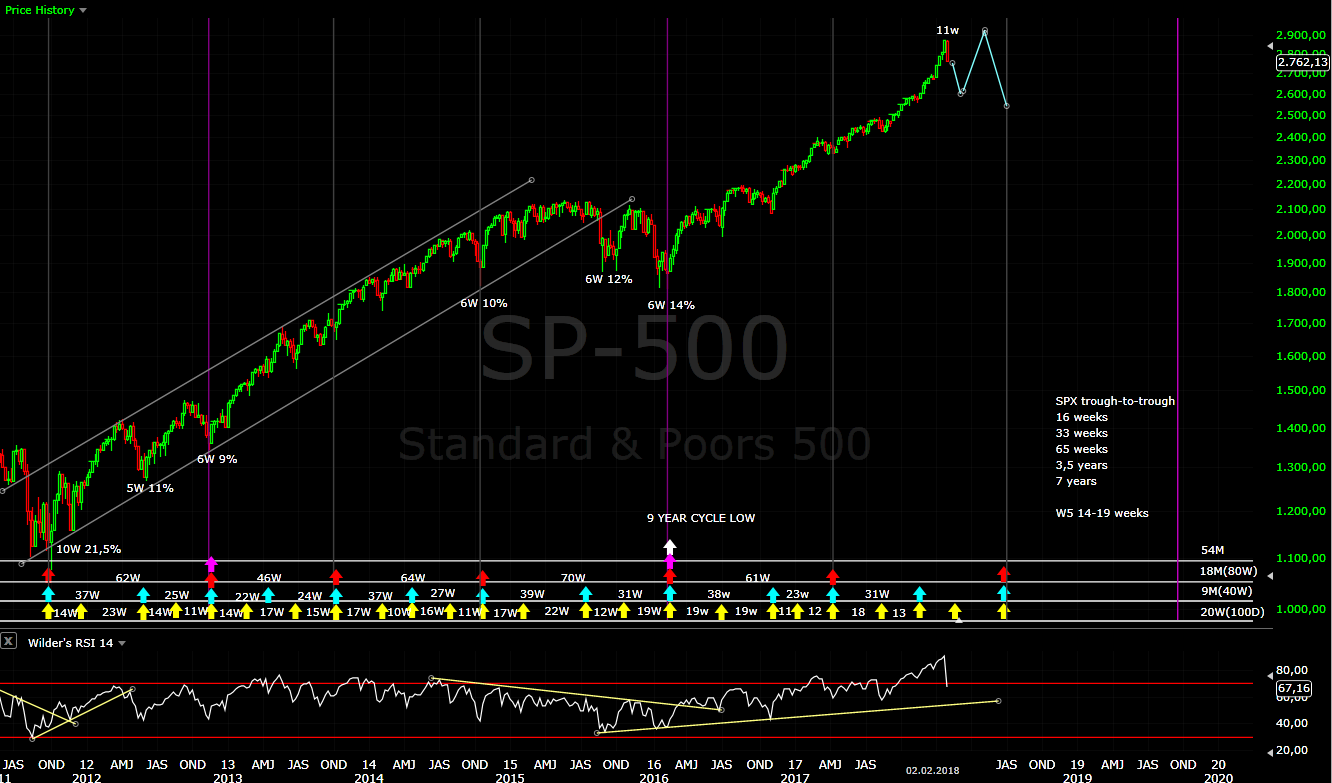
Short term - the price is well below MA50/MA200 and most likely every move up will be met with selling until the dust settles down. Choppy moves in the next 1-2 weeks, but higher lows.... we have already overlapping the only surprise I can see is one more leg lower for leading diagonal.


Intermediate term - Fibo 38,2% retracement/MA200/the trend line hit and strong reversal in 2 weeks, this wave IV is really breathtaking:) A few weeks needed to confirm a bottom and no new lows:) I think this are the two possible patterns a few weeks or a few months to digest the shock.


Long term - this is the expected correction(wave 4) now waiting for confirmed bottom and the final rally higher. RSI looks ugly and the message is one more high and it is over.


MARKET BREADTH INDICATORS
Market Breadth Indicators - are bearish, some oversold, most of them reached levels where you see a bottom for a correction. VIX and McClellan oscillator are showing divergence. No reversal sign so far.
McClellan Oscillator - at oversold levels with divergence.
McClellan Summation Index - sell signal.
Weekly Stochastic of the Summation Index - sell signal.
Bullish Percentage - around 40 where you expect a bottom for a correction.
Percent of Stocks above MA50 - oversold below 25, where you expect a bottom for a correction.
Fear Indicator VIX - lower high and divergence.
Advance-Decline Issues - reached oversold levels.


HURST CYCLES
Day 28 of the 40 day cycle. Some are counting extended cycle 58 days or you can count shorter cycle, the previous two were 27 and 30 days long. At the end the message is the same this should be 40 day cycle low.


Week 12 of the 20 week cycle. There is two options depending which scenario will play out. They are shown on the daily chart.
The second scenario the 18 month cycle low was in August not in April which means this should be 40 week cycle low. After such sharp sell off if we see another higher high this must be 40 week low. This is my preferred pattern so I switched to this cycle count. If we see the triangle developing I will revert back to shorter 18 month cycle.


Tom Demark SEQUENTIAL AND COUNTDOWN - this technique spots areas of exhaustion.
Buy setup finished on the daily chart... and reversal.

Feb 9, 2018

Update

The speed is crazy the pattern develops in a few days instead of a few weeks.
20 points needed to hit EMA200 and C=0,618xA, 40 points needed to hit 38,2% Fibo retracement of wave III and SMA200 (0,5%-1% in the blink of an eye in current conditions:). European indexes(and SOX) are finishing expanded flat which begun in November. Market breadth reached levels where you see a bottom for a correction and the first divergences VIX and McClellan oscillator. Too many red flags on the short side.

I think the more likely scenario is that the correction is finishing. If I am wrong wave B 50% or more retracement... do you really want to ride 200 points against you if you are short?

Feb 8, 2018

Update

Here is a chart for the impatient:) currently I see this - wave b of B. Test of MA50/MA200 hourly and then lower to test MA200 daily.

Feb 6, 2018

Some thoughts

This is how greed ends.... to quote stupidity caused by greed - "DJ 30k without correction positive thinking".
I repeated two weeks in a row "what goes vertically higher comes the same way lower", look at March 2000 "all the January gains will be wiped out in February".... it is never different it is always the same, because the reason is human greed and stupidity and it does not matter if it is about tulips,bitcoins,volatility or what ever.
First the Bitcoin guys feeling the pain and still buying the dips and now the short volatility traders seeing the trade exploding in their face. The unthinkable happened - VIX doubled in one day, XIV down more than 80% and according the prospect should be liquidated. Volatility suppressed unnaturally around 10 or below for a year and now short volatility traders receive their margin call. Bitcoin looks like a walk in the park:) if you ask me.

So the short volatility trade imploded taking the market lower with it. I have read a few times that this trade is very dangerous, here is one podcats (from minute 12)..... I can not say if there is more positions to be unwinded or not, I am just a chart guy. According to the guy from the podcast ETFs/ETNs like XIV are the least problem.


I hope you did not let greed dictate your actions and took profits. It was a great run since November, but it was time to take your money off the table and go short. What now? The bulls must pray that FED will save the market:), but FED said it will take the punch bowl away and it cares about the bond market where the skyrocketing yields are problem, the stock market is less interesting. It could start QE again when they said they will do the opposite or.... move money out of stocks into bonds. This panic comes right on time, what happened with yields yesterday:) I think they will save the day just to let the stock market drop later hoping it will decline in orderly manner.

So what about the charts, what we know - the move looks like an impulse, usually the panic low is not the low, based on history this moves has the DNA of a sharp correction in a bull market caused by excessive greed, usually a bear market starts slowly and not with a crash.
What we do not know - two options the bull market is over or this is wave IV. How should the price action look like:
- the bull market is over - we have an impulse so this is wave 1, but extreme fear and most of the fuel to the downside is burnt. I would expect wave 2 deep retracement lasting for months so that traders forget the pain and talk about DJ 30k again. Example - August 2015 panic sell off for three days followed by wave B for 3-4 months.
- this is wave IV - this impulse lower is wave A, wave B should follow. It should move quickly higher and retrace at least 50% of the sell off. Examples March 2000 or February 2007 - a-b-c zig-zag with one panic wave and the other one shorter 61,8% Fibo. The current wave is obviously the panic move so after wave B expect wave C=0,681xA.

How will the chart look like in both cases(of course the wave lower could have a few more percent lower) - green the bull market is not over, red the bearish case.
I still think such price action fits better as wave IV, but lets see if we have A-B-C test of MA200 or something else.

Feb 3, 2018

Weekly preview

Short term view - one more leg lower to MA50 and short term bottom.
Intermediate term view - the move lower should last for a few weeks. The pattern develops so far like wave IV from the Feb.2016 low.

The indexes turned lower with scary sell off on Friday... such development is not a big surprise. As I wrote two weeks ago what goes vertically higher comes the same way lower. Just look what happened the next month after the exhaustion monthly bar in March 2000 - all gains were retraced. If my count is right all the January gains will be wiped out in February. Nothing new under the sun:) the same old story greed and fear.

It is just one week, but time and pattern are pointing at wave IV from Feb.2016 at the moment. The current pattern lower develops as an impulse(more to the downside), 20 week cycle low is expected late February/early March(a few more weeks lower), market breadth turned lower, but not even close to oversold (a few weeks before we see an intermediate term low).


TECHNICAL PICTURE and ELLIOTT WAVES
Short term - gap below the first support level and sell off to the second support level/the trend line/MA200. We still need to see wave 4 and 5 for confirmation, but no signs of a bottom - price and indicators are just moving lower. So with high probability we will see the missing waves next week.


Intermediate term - currently it develops like impulse lower to MA50. This means bounce higher from MA50 for wave B and one more leg lower for a finished zig-zag wave IV around 0,236 Fibo retracement and the tend line just on time for a 20 week cycle low. RSI is breaking a lot of trend lines which means this is not some lower degree wave the only one which fits is wave IV.
P.S. The Fibo measurements for the impulse from Feb.2016 are way too perfect... scary:) when it looks perfect something goes wrong.


Long term - it looks the expected correction is running. RSI is about to test the trend line and this should be a wave of higher degree and this is wave 4.
I still expect one more leg higher before a major top. Indexes like DAX and EEM still need one more wave higher and market breadth does not suggest that this is the final top.


MARKET BREADTH INDICATORS
Market Breadth Indicators - are pointing lower, sell signals across the board.... looking at the indicators I would say we need a few weeks before the next intermediate term low.
McClellan Oscillator - reached oversold levels bounce is expected soon.
McClellan Summation Index - sell signal.
Weekly Stochastic of the Summation Index - sell signal.
Bullish Percentage - turned lower with sell signal, but well above 70.
Percent of Stocks above MA50 - sell signal, pointing lower and below 75.
Fear Indicator VIX - break out of the wedge.
Advance-Decline Issues - lower for weeks, but still not oversold.


HURST CYCLES
Day 23 of the 40 day cycle. It turned lower, the price broke below the cycle trend line and MA10.


Week 11 of the 20 week cycle. Given the sell off on Friday it should be heading lower already.