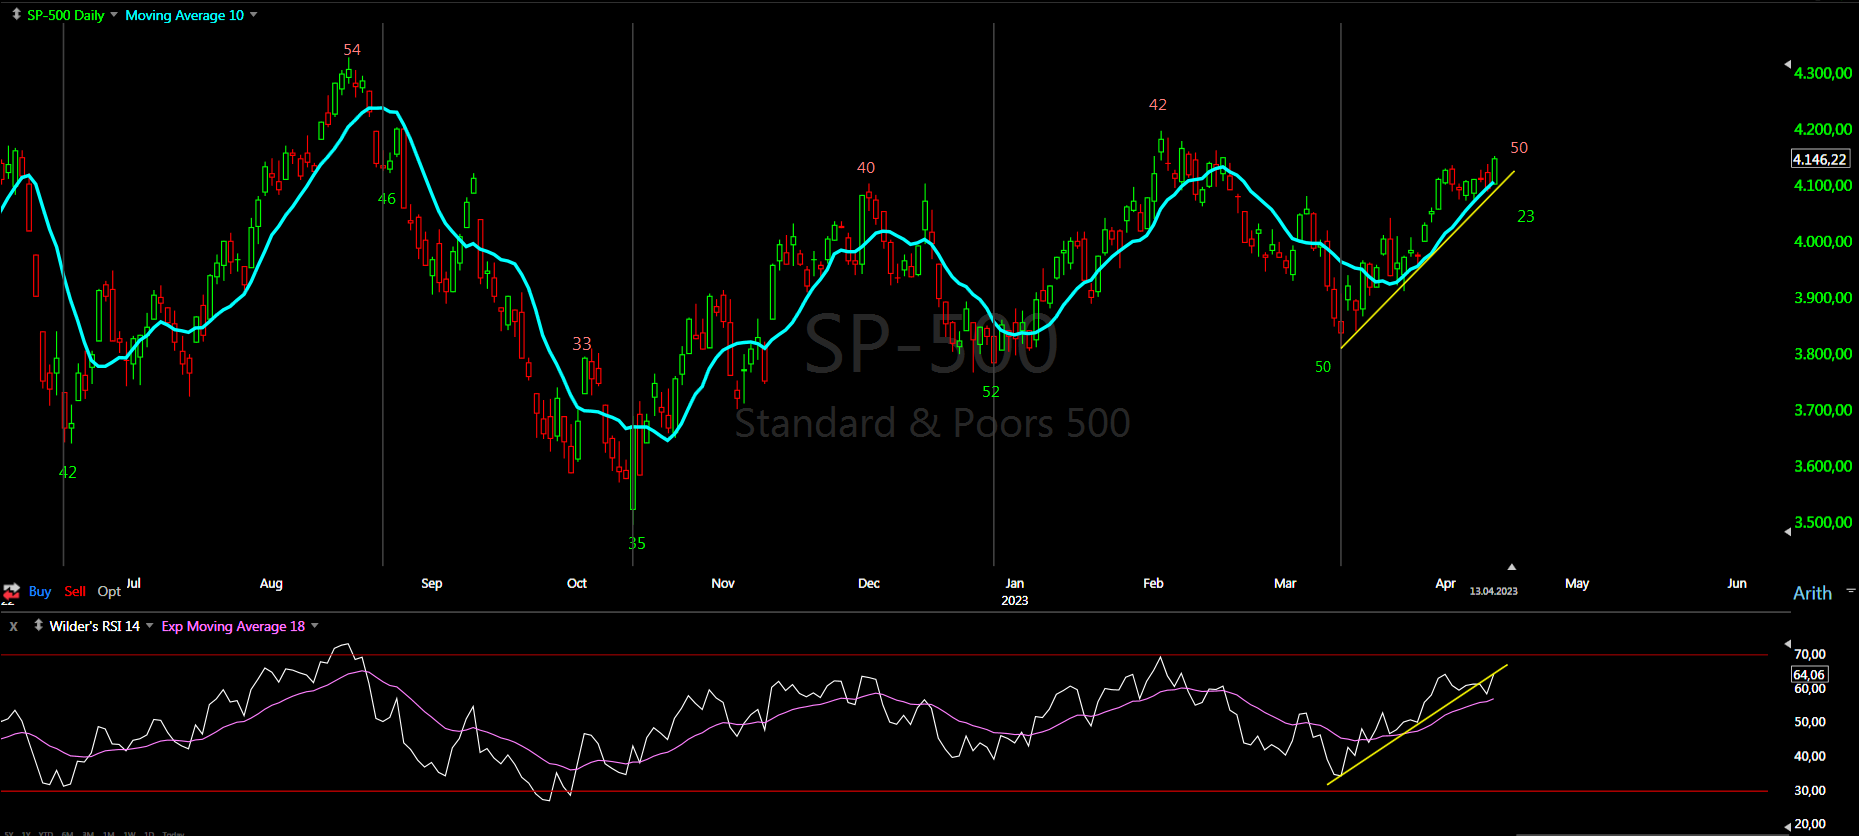
Trading trigger - buy signal.... short cycleonly 31 days?
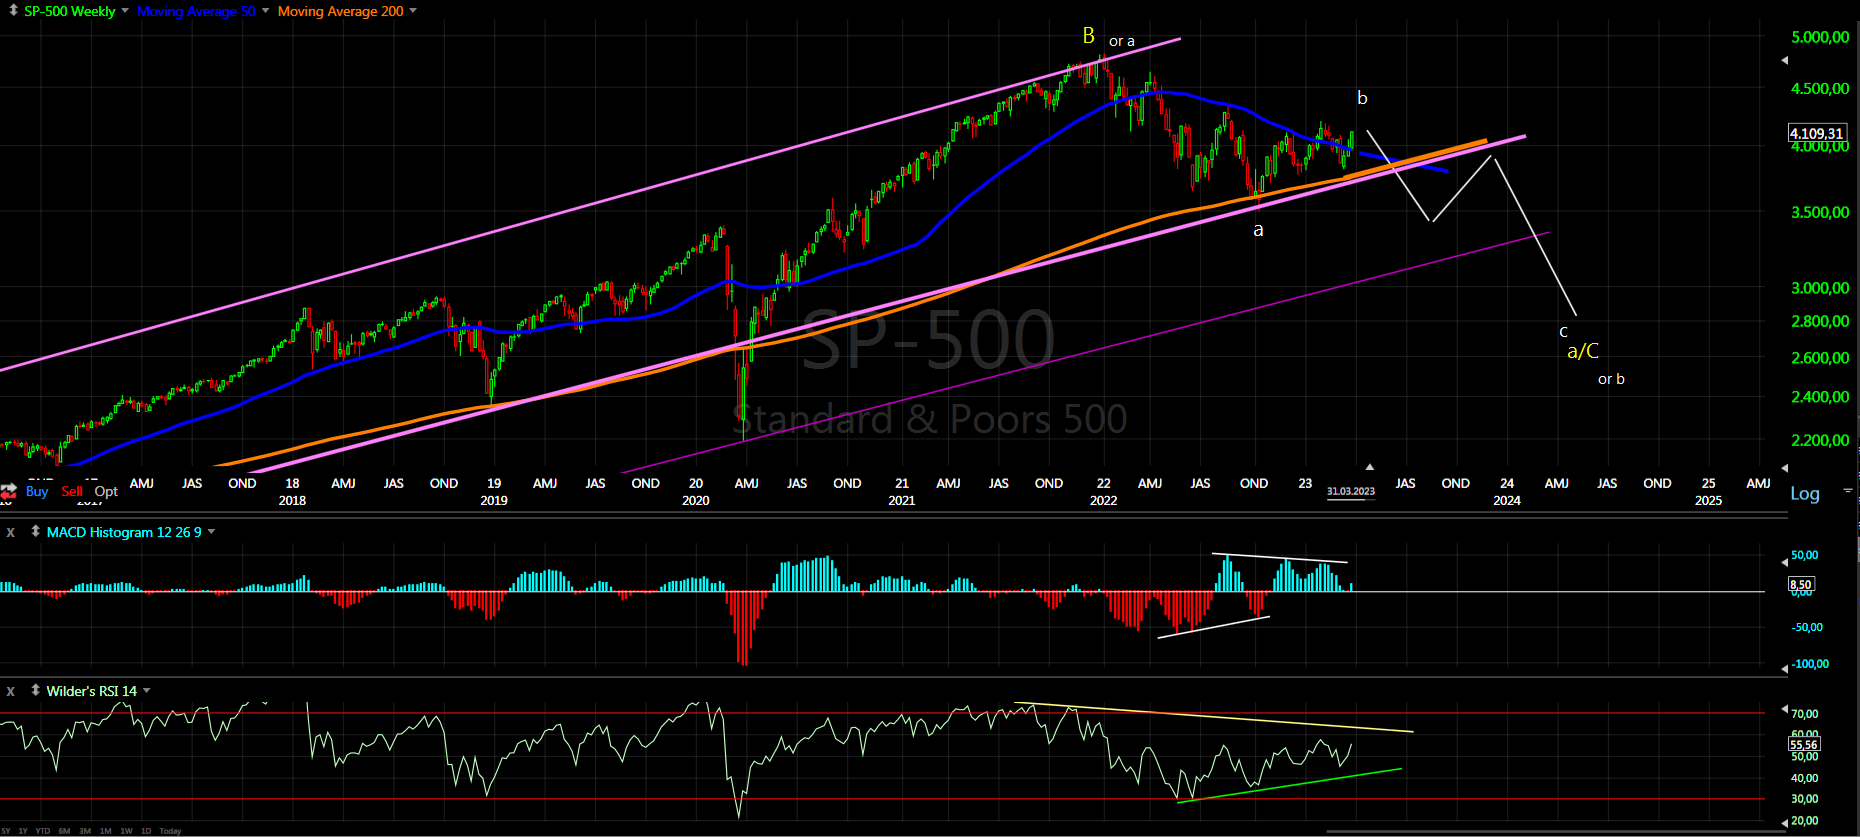
Analysis - long term sell the rips, we have major top. Intermediate term high - impotant high expected.
P.S. - for a trade both analysis and trigger should point in the same direction.

TECHNICAL PICTURE and ELLIOTT WAVES
Short term - zig-zag higher, sideways correction and now another zig-zag higher.

Intermediate term - the indices are close to the top of the correction. It is a complex pattern there is different possible combinations and I am not sure where the B-wave starts - in June or October. It could be w-x-y or triangle starting in June.

Long term - most likely huge double zig-zag from the 2009 low B-wave was completed and multi year decline has started. If we are lucky it is lower degree b-wave.

MARKET BREADTH INDICATORS
Market Breadth Indicators - mixed some pointing higher other pointing lower in the middle of the ranges... only the complacency is high.
McClellan Oscillator - now above zero.
McClellan Summation Index - sell signal.
Weekly Stochastic of the Summation Index - buy signal.
Bullish Percentage - in the middle of the range.
Percent of Stocks above MA50 - turned higher, in the middle of the range.
Fear Indicator VIX - up another low and more complacency.
Advance-Decline Issues - turned higher, in the middle of the range.
HURST CYCLES
Short term cycles - close to 20d high maybe around FOMC then it will get interesting.
The low this week is it long 5w cycle or short 10w cycle? The previous high is 10w high and the next high should be 20w high to complete the B-wave so in theory judging by the neighbouring highs this should be 10w low.

Week 7 for the 20w cycle. Close to important high and next should be the last 40w cycle of the 4y cycle.