Trading trigger - buy signal.
Analysis - intermediate term high and a few months lower will follow.
P.S. - for a trade both analysis and trigger should point in the same direction.

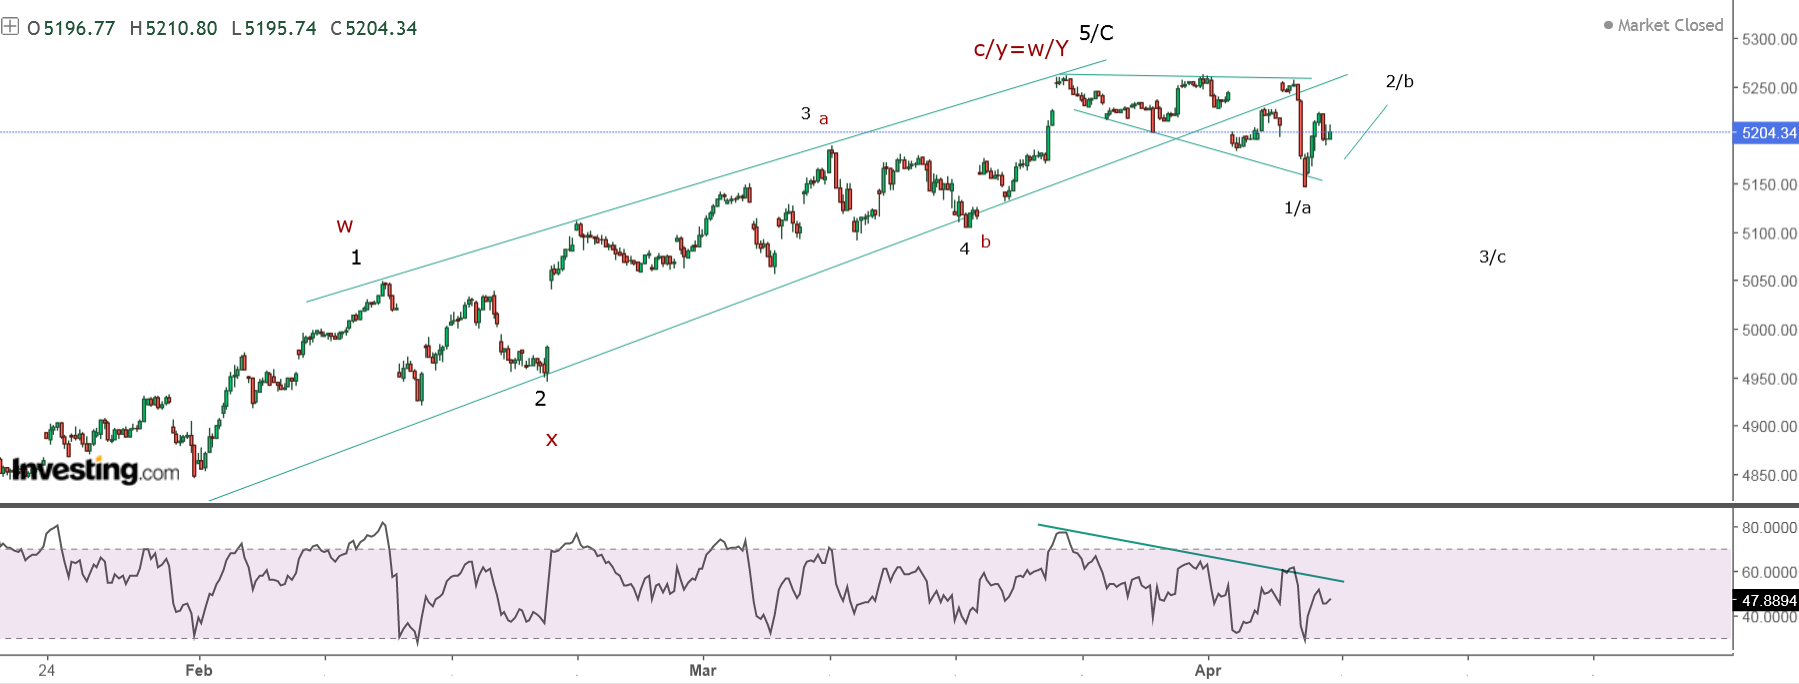
TECHNICAL PICTURE and ELLIOTT WAVES
Short term - a-b-c lower and now higher - in theory another leg lower should follow. Alternate the correction is more complex than simple a-b-c.

Intermediate term - intermediate term top and the first wave lower.... a few months lower should follow.

Long term - 4y cycle high the end of 2021, now a-b-c lower into 4y cycle low. Alternate this is the top of wave-B from 2009.

MARKET BREADTH INDICATORS
Market Breadth Indicators - a pause on the way lower.
McClellan Oscillator - around zero.
McClellan Summation Index - sell signal.
Weekly Stochastic of the Summation Index - sell signal.
Bullish Percentage - in the middle of the range.
Percent of Stocks above MA50 - in the middle of the range.
Advance-Decline Issues - in the middle of the range.
Fear Indicator VIX - retracing lower.
HURST CYCLES
Short term cycles - at 20d high next is lower into 20d low. This correction higher should be 5w high.

Week 26 for the 40w cycle. Probably 20w low at week 20 in March and expected 40w cycle low in June. Projection if the 10w cycle continue with the same length.

Gold long term - at 4y cycle high. First 16y high and major low should be completed before it goes balistic.
The gold "experts" are everywhere explaining you to buy..... at the top of course.